Management by exception
Human instinct is optimized to detect changes and exceptions in the environment. This way we can make important decisions quickly and efficiently. That’s just how we are wired. NOC operators, DevOps engineers and customer service desk staff are, of course, no different.

Management by exception builds on that principle and is used by the vast majority of network operations centers (NOC): it allows operators to instantly be notified of an exceptional situation (e.g. service outage) and act on it (e.g. switching to reliable infrastructure or switching to a backup signal). In the recent past, most of the common, repeatable actions, such as ticket creation or switching to backups, have already been automated.
Many operators have DataMiner in place to detect, visualize and act upon exceptions. First, exceptional situations are usually retrieved from a combination of alarms using DataMiner Root Cause Analysis and Correlation.
Second, DataMiner visualizes the penalty box on large video walls in the NOC as well as on a personalized dashboard on the operator desk. The DataMiner penalty box can easily be adjusted to the needs of the users; for example, operators can opt to only see services that are degraded or fully offline. And since penalty boxes may also contain live video and audio levels, DataMiner also routes the signals to the correct PIP of the multiviewers.
Third, DataMiner can recover from incidents by activating redundancy on the network. It can also create or update tickets in the ticketing system, among other automated actions.
All of this is already very advanced, but recent technological and business transformation actually shows that “management by exception” is becoming a greater challenge than ever in the modern workplace. Fortunately, the DataMiner Management by Exception solution has evolved along: it has become a more intelligent, automated, and proactive environment than any other “penalty box” viewer on the market.
It all starts with capturing the right data
Traditional on-premises, ASI- and SDI-based infrastructures usually rely on data reported by dedicated monitoring probes. These probes are deployed at the output or handover point of the network (e.g. the output of the playout, the headend or the uplink).
For a long time, this has been an ideal solution, because any failure on those monitoring points would instantly indicate the impact on the end user. In almost all cases, however, the exception alert would indicate that the service is already down. In other words, a management by exception setup like this is a reactive environment, merely reporting exceptions on broadcast services.
Measure everything, everywhere with multi-point monitoring
DataMiner not only captures service performance and availability statistics from confidence monitoring points at the service egress points in the network. It also ingests information from probes that are deployed at the ingress point (i.e. sources) and from probes that are deployed at intermediary monitoring points in the service data plane. It even ingests information from service-impacting counters and events of the actual service processing data plane resources, such as media transcoders and broadband CMTSs.
Moreover, as service data planes are deployed in the cloud (e.g. OTT delivery and content contribution), DataMiner also deploys and sets up probes as needed in any cloud (multi-cloud) and any region of the world (multi-region).
Many organizations have specialist test and measurement (T&M) systems in their labs. Think of video and audio analyzers, IP test equipment or spectrum analyzers, for example. Engineering and level-3 support teams own them and are trained to use them. However, in reality, the vast majority of the T&M inventory is sitting idle for most of the time—sometimes just sitting on the shelf, powered off.
The good news is that DataMiner does use this valuable inventory to scan through your service lineup and route signals to the monitoring points. This can be scheduled round-robin, upon operator request, during service orchestration (service life cycle management – LSO), or simply because DataMiner detected other signs of service degradation or outages. In that case, it uses the T&M system to capture more details about the exception happening in the network. And, of course, engineers and L3 operations can still use their T&M products exactly as they want.
| Multi-point probing | Typical penalty box | DataMiner Management by Exception solution |
| Capture service performance and availability stats from monitoring probes at service egress points | Yes | Yes |
| Multi-point confidence monitoring at service ingress, intermediate and egress points | Sometimes | Yes, including automatic root cause analysis |
| Multi-cloud and multi-region cloud monitoring probes | No, cloud monitoring is often operated with separate tools | Yes, DataMiner deploys and orchestrates probes in any cloud and any region |
| Leverage T&M inventory in an intelligent manner | No | Yes |
| Automated routing of service to monitoring probes, T&M products and multiviewers | Limited | Yes (L-Band, ASI, SDI, IP IGMP and SDN-based routing) |
| Capture service stats from the service data plane processing products, appliances and cloud services (NFV) | No | Yes, DataMiner is integrated with +7000 APIs of media, ICT and broadband processing products, appliances, and cloud functions |
| Monitor health of SaaS services in the service pipeline | No | Yes |
Full observability requires insight into ICT stacks and cloud deployments
Service data planes are deployed as a chain of products, each taking care of one or multiple processing steps. Examples are media IRDs, media gateways, media transcoders and streamers, data and broadband IP shapers and compressors and broadband CMTSs. With the move to using ICT COTS and cloud infrastructures, service performance and availability is heavily subject to the health status of the underlying on-premises ICT stack (hardware and VNI) and cloud platforms.
Consequently, monitoring of the deployment stack has become an essential requirement for any NOC operation. DataMiner does all of that in a convenient manner. And convenience is the key word here, because the number of metrics, counters, logs and events generated by ICT and virtualized infrastructures is massive. DataMiner has intelligence on board to map the impact of any metric (CPU, memory, disk access speed, IP packet errors, jitter, etc.) on service level (service impact analysis).
| ICT and cloud monitoring | Typical penalty box | DataMiner Management by Exception solution |
| Monitoring of the on-premises ICT infrastructure | No | Yes, including service impact analysis |
| Monitoring of the virtualization layer | No | Yes (virtual machines and containers), including service impact analysis |
| Monitoring of the cloud platform health (PaaS) | No | Yes, multi-cloud, including service impact analysis |
| Monitoring of cloud connections | No | Yes, multi-cloud and multi-region, and including service impact analysis |
The importance of healthy control planes
Most service consumption happens upon request of the end user (on demand). Think of OTT services, VoD, targeted advertising or broadband services, for example. The user experience is a total experience, including the convenience to find services that match the user profile, to request the service, to change or retune, and any other interaction.
This means that media and broadband companies rely heavily on complex control planes that manage user sessions for media/broadband/VoIP, user profiles, service catalogs, and much more. Or put differently, monitoring the service data planes needs to be complemented with monitoring of the service control planes.
| Control Plane Monitoring | Typical penalty box | DataMiner Management by Exception solution |
| Monitoring of service control plane deployments, e.g. session managers, content recommendation systems, program guides, etc. | No | Yes, including service impact analysis |
| Monitoring of auto-scaling cloud control plane services | No | Yes, including service impact analysis |
The end user has the final say
Naturally, as service consumption evolves from a broadcast “push” model to a “pull” model, the end user is king. In a push model, each end user consumes the exact same service. In a pull model, the end user requests the service when and where needed, on the player of choice. In other words, each end user may experience the service differently depending on the time, location, or device, but also depending on the number of users consuming services simultaneously.
Consequently, a management by exception solution requires integration of UEx data. As the industry has been evolving very fast, many operators have been trying to keep up by rapidly deploying UEx monitoring in isolation from their network operations. DataMiner, however, combines both, which is infinitely preferable. The DataMiner Data Aggregation Module collects and aggregates vast amounts of end user data and uses that data to indicate root causes of service degradations and outages in the network and service topology.
| UEx data inclusion | Typical penalty box | DataMiner Management by Exception solution |
| Integration of network as well as UEx performance data | No | Yes |
| Direct collection of end-user performance data | No | Yes |
| Ingestion of UEx session data from a third-party data lake | No | Yes |
| High-performance end-user session data aggregation | No | Yes, including service performance and availability reporting on network and service topologies |
Synthetic testing: detect even the most elusive issues
The nature and complexity of media and broadband service delivery requires active monitoring of the service delivery network. Some things—including erroneous situations—only become visible when actively searched for. Think of a failing DNS service, for example: even if an entire network has been up and running for a long time, just a simple reboot or reconfiguration of the network may cause a vast amount of ICT systems to halt, which in turn causes huge service outages.
DataMiner can easily be configured to prevent that, using the DataMiner Synthetic Testing application to test main and backup DNS services. And similar use cases apply to, among others, checking network firewalls and load balancers in an active manner.
| Synthetic testing | Typical penalty box | DataMiner Management by Exception solution |
| Synthetic testing of ICT services | No | Yes |
| Synthetic testing of end-user services | No (often done by separate tools) | Yes |
What is an “exception”?
Exceptions, such as service outages or severe degradations, are the result of a correct interpretation of all the data points as mentioned earlier. Those data sets reflect the service status accurately. But there’s more information required before an operator can judge whether a situation is “healthy” or “normal” compared to “exceptional”, “deviating” or “abnormal”.
How do you distinguish the “exceptional” from the “as-expected”?
Networks, service catalogs and lineups change constantly. Platforms have evolved to become more agile and scalable, and to handle changes faster and more easily. In turn, that poses challenges to the typical management by exception setups. The definition of “exceptional” changes as fast as the business does. It even changes while teams are interacting with the platform and while partners in the supply chain are interacting with your organization. Imagine that DataMiner did not read the playlist or EPG schedules: How would DataMiner correctly flag when a service is missing? How would DataMiner signal a missing audio track or language?
Similarly, if one of your teams schedules a channel change or planned maintenance, how would DataMiner be able to tell apart planned actions that may affect services from the unexpected or exceptional?
And to move even further along the supply chain: if one of your business customers changes the time slot for an occasional use feed, how would your operators act if DataMiner did not take that change request into account?
As organizations go through digital transformation, DataMiner is the platform of choice to capture all contextual data in the business and operations. It then uses that data to re-provision the monitoring points and to determine whether a service change is exceptional or not.
| Context awareness | Traditional error reporting | DataMiner |
| Ticket awareness | No | Yes |
| Planned maintenance awareness | No | Yes |
| Service schedule awareness | No | Yes |
| Service content awareness (e.g. EPG) | No | Yes |
| Service change awareness | No | Yes |
Data Analysis – AI: early signs & proactiveness
In large, slowly moving datasets (e.g. ICT or data plane monitoring datasets), or for the statistics from a large set of end-user terminals, you need change point detection to detect trends that wouldn’t be visible to the naked eye. This is the only way to catch upcoming problems before they can affect a service. This is what AI excels at.
DataMiner analyzes all information automatically, and by design. This solution works straight out of the box, through standard algorithms as well as through patented AI anomaly detection methods. This is what makes our solution truly proactive.
| Reactive vs proactive analysis | Traditional (Reactive) | DataMiner (Proactive) |
| Detects errors in the network | Yes | Yes |
| Predicts errors based on behavioral and configuration anomalies | No | Yes |
| Detects early signs from ICT layers (slow-moving trend change detection) | No | Yes |
| Detects early signs in cloud/multi-cloud systems | No | Yes |
In short, DataMiner can detect changes at an early stage before they actually manifest themselves. This gives operators the necessary time and information to avoid service downtime. This is proactive monitoring, instead of classic reactive monitoring.
It's time to act, for all stakeholders
When exceptional situations occur, action needs to be taken! The DataMiner Management by Exception solution can easily provide that convenience to operators and teams.
Depending on the operator priorities, DataMiner can take several actions. Some users just want to have a penalty dashboard on their desk while others prefer automated routing of the failing service to the large multiviewer wall. Some even rely on DataMiner to give hints for remediation (suggestions) to operators. And an increasing number of operators rely on DataMiner’s automated remediation. So as a DataMiner user, you decide how operators use the intelligence of DataMiner.
It’s also important to set up an operation and supply chain in which all teams and organizations take synchronized actions. Collaboration is essential to remediate quickly and consciously, across teams and organizations (e.g. content providers, cloud providers, network capacity providers, etc.).
DataMiner comes with a vast set of solutions to collaborate, leveraging the DataMiner Cloud Platform. Examples are shared dashboards and applications, integration with OSS systems including third-party ticketing, and integrations with collaboration services such as Teams and Slack.
| Actionability | Traditional Confidence Monitoring | DataMiner Management by Exception |
| Static multiviewer control including penalty box | Yes | Yes |
| Dynamic multiviewer control including penalty box | Yes | Yes |
| Personalized multiviewer on the desk, including personalized penalty box | No | Yes |
| Suggestive notifications | No | Yes |
| Automated backup switching | Yes | Yes |
| Automated re-deployment and rescaling of services | No | Yes |
| Automatic ticket creation | No | Yes |
| Dashboard sharing across teams and across the supply chain | No | Yes |
| Teams & Slack integration | No | Yes |
In summary: management by exception is at the heart of quality assurance
All the aspects above make DataMiner your go-to platform for overall quality management of your services, especially in a time when your services diversify on a technical as well as on a user-consumption level. This full 360° quality management from source to end user keeps your quality of service high, all the while rationalizing your costs in terms of equipment and operators.
DataMiner makes the difference by providing this open, cloud-connected platform focused on observability, actionability, and collaboration. All of this enables management by exception that delivers its full value to your operation and your customers.
Learn more about how broadcast operations can break through operational silos and really unlock the potential of IP media infrastructures.
In this webinar you will gain insight in both the present situation and the way the migration to IP content exchange can really result in more agile, scalable and end-to-end media workflows.
Please note that you need to be logged in to access our video library: in the top corner of the screen, click LOG IN and authenticate yourself with your corporate email address.
Broadcast operation and automation
YOU'LL LEARN
- master your broadcast operation
- easily perform complex tasks quickly
- do path detection and visualization
Master Control Room
MCR and NOC automation and orchestration
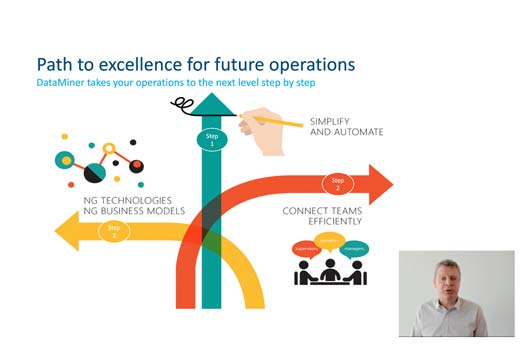
The technology- and vendor-agnostic DataMiner platform is the key enabler for broadcast centers to evolve to next-generation technologies. It allows the simplification and automation of workflows throughout the MCR, with AI-powered end-to-end monitoring, control and orchestration, and effectively reduces the operational workload while maximizing resource utilization.
Let's talk about your project
Are you interested to know if this standard solution also offers possibilities for your project? You can either ask your question right here on our Dojo community. Or, if you prefer the more personal touch, you can also contact your local sales representative. Either way, our DataMiner experts will be happy to discuss all the possibilities with you, down to the smallest detail.