The DataMiner documentation is continuously growing and improving. That’s why from time to time we like to provide you with a summary of all things new in the DataMiner Docs.
Here’s a quick overview of the changes we’ve done to the documentation for DataMiner 10.4.4:
- A WebSocket connection status indicator has been added to the header bar of both the Dashboards app and the Monitoring app. This intuitive indicator provides a quick glance at the current status of your connection.
- A migration tool was introduced, designed to facilitate the transition from Elasticsearch to OpenSearch.
- GQI logging is now available, which means errors and warnings will be conveniently logged to log files. You have the flexibility to customize the minimum log level, controlling the extent of information included in the log files, tailored to your specific needs.
- You can now conveniently access the dataminer.services home page via the Cloud page in DataMiner Cube.
- The IGQIUpdateable interface is now available in the ad hoc data script. This interface can be implemented by an ad hoc data source class to provide real-time updates.
- Users now only require the Modules > Automation > Execute user permission to execute Automation scripts. Previously, access to the Modules > Automation > UI available user permission was also necessary. This refinement enables granular permission control, allowing users to execute scripts in specific environments such as Visio without needing access to all Automation scripts in the system.
- Several changes have been introduced for the dropdown, list, and tree components in Dashboards and Low-Code Apps:
- When you apply a single query data feed, the resulting query rows are now listed instead of the query itself.
- Real-time updates are now supported for values displayed in the component, provided the Update data setting is enabled.
- Easily clear selected values in the dropdown component by clicking the new X button in the top-right corner of the filter box.
- … and more!
Curious about the enhancements to the dropdown component? Check out this blog post highlighting the advantages of pairing GQI queries with the dropdown visualization, a truly dynamic duo.
But those are not the only things we’ve changed recently!
- Embark on your journey with the Asset Management application effortlessly, thanks to our new documentation.
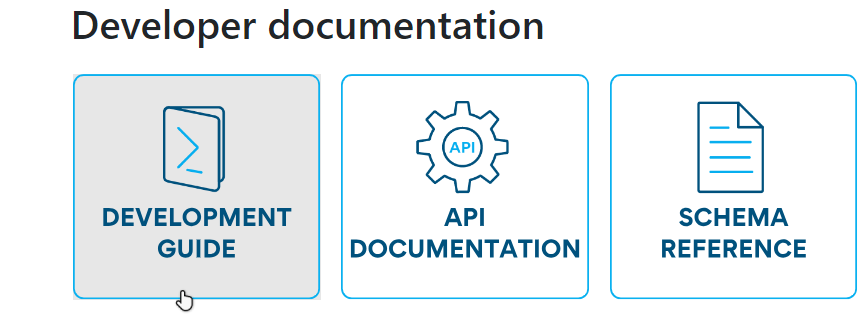
- The Developer documentation and DataMiner Overview home pages have undergone a makeover, offering seamless navigation to different sections of the documentation via intuitive tiles.

- The DIS troubleshooting section has been improved and expanded upon.
- Explore our new tutorials:
- Creating a parameter table connected to an element feed: In this 10-minute tutorial, you’ll learn how to craft a GQI query to display parameters from a specific protocol table in a dashboard and to link the query to an element feed to control which element’s data is shown in the table.
- Setting up basic CI/CD for connector deployment: In this 20-minute tutorial, you’ll learn how to set up basic quality control and automatic deployment of a DataMiner connector to a staging system through a CI/CD pipeline.
Noticed something that could be improved in the DataMiner documentation? Your feedback can make the difference! Submit an issue or propose your changes on GitHub! If you’re a DevOps Professional, you’ll also score some points in the process 😊
