The DataMiner documentation is continuously growing and improving. That’s why from time to time we like to provide you with a summary of all things new in the DataMiner Docs.
Here’s a quick overview of the main changes in the documentation for DataMiner 10.3.12:
- On spectrum analyzer cards, the info pane now facilitates setting a marker back at the center frequency by clicking the center frequency button to the right of the marker, and you can now also adjust the resolution bandwidth and the video bandwidth with new plus and minus buttons.
- Enhancements in the anomaly alarm settings of the alarm template editor now allow you to configure alarms for an expanded range of anomaly detection types. For example, you can generate alarms for upward spikes while excluding downward spikes. Additionally, you can now define custom alarm thresholds for anomaly detection of type Level shift and Outlier.
- The focus icon in the alarm bar of the Alarm Console is now only visible when the Active alarms tab contains focused alarms. It also includes a numerical indicator, displaying the number of focused alarms in the Active alarms tab.
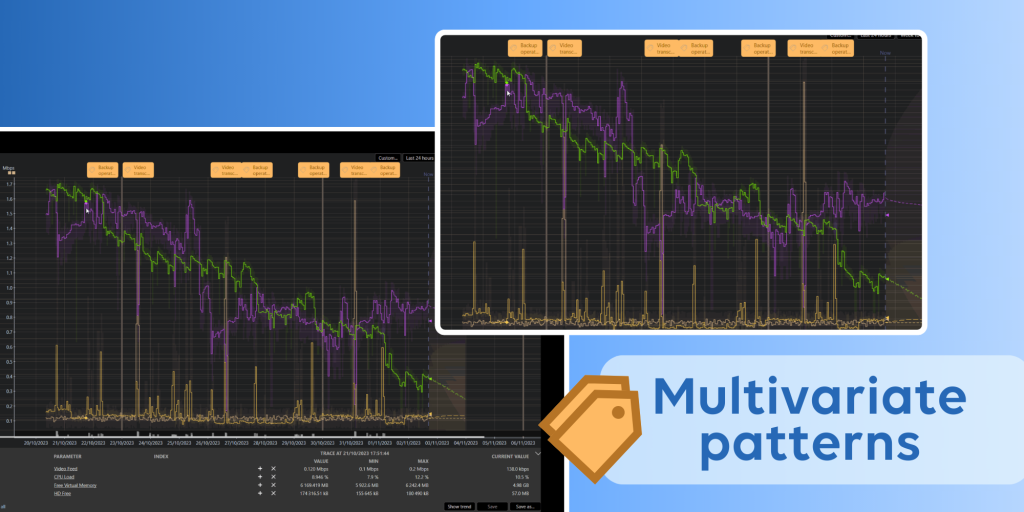
- For multivariate patterns, trend patterns of all related parameters are now loaded onto the trend graph.
Multivariate patterns allow you to add context to your trend graphs and to discover relationships among multiple parameters.
Curious to read more?
Content Expert: Willem Mélange
But those are not the only things we’ve changed recently!
- Our documentation on configuring SAML has been completely revamped, extended, and improved.
- More extensive information has been added on the migration of profile and resource data to an indexing database. This migration is mandatory to be able to upgrade to DataMiner 10.4.0 or higher, as XML storage for profiles and resources will no longer be supported.
- Several changes have been made to improve the documentation on Dashboards and Low-Code Apps:
- We now offer a more intuitive overview of all available visualizations, featuring the same icons you encounter in both applications.
- A new Configuring components section was introduced, complete with several subpages to simplify the process of configuring your components.
- New instructions on changing the low-code app settings were added.
- New instructions on configuring the low-code app layout were added.
Noticed something that could be improved in the DataMiner documentation? Your feedback can make the difference! Submit an issue or propose your changes on GitHub! If you’re a DevOps Professional, you’ll also score some points in the process 😊
Very much like the overview of all dashboard and low-code app visualizations!