In a previous blog post, titled Using the power of insights for your investigations, we demonstrated how to enhance your data analysis experience, uncovering patterns across multiple parameters. Now, we’re excited to present multivariate patterns, a feature that will take your trend graphs to the next level. Multivariate patterns allow you to add context to your trend graphs and discover relationships among multiple parameters.
Multivariate patterns offer a fascinating and powerful way of exploring and analyzing data involving more than one parameter. Unlike univariate patterns, which focus on the distribution and characteristics of a single parameter, multivariate patterns reveal the relationships among multiple parameters. For instance, a multivariate pattern can demonstrate the interconnectedness of the network bandwidth, latency, and packet loss. It can also showcase how signal strength, noise level, and modulation scheme impact the data rate. Multivariate patterns can help us detect anomalies, verify hypotheses, and provide context for complex data sets.
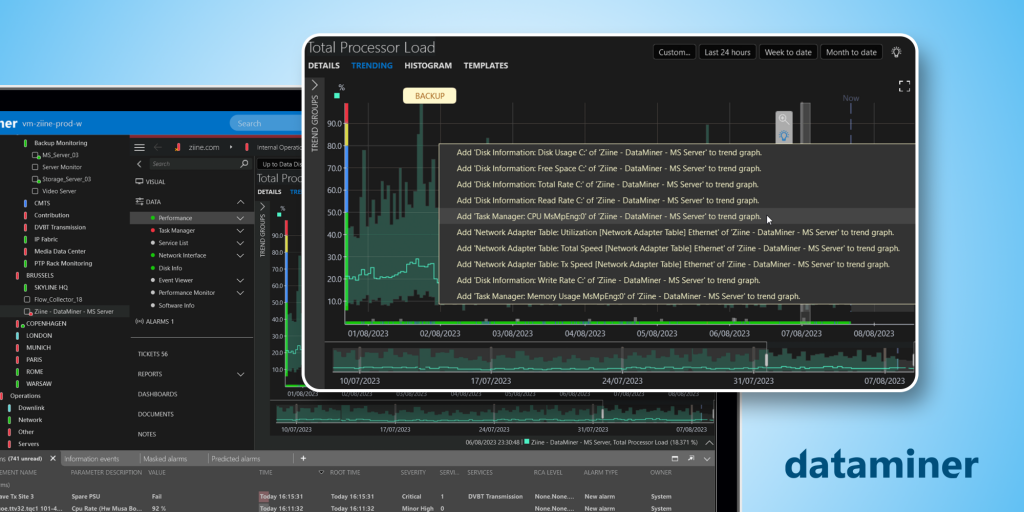
In DataMiner Cube, you can swiftly define patterns in trend graphs showing trend information for both a single parameter (univariate patterns) or multiple parameters (multivariate patterns). From DataMiner 10.3.12 onwards, you can load all patterns related to the multivariate pattern by clicking the ![]() icon. When you access a trend graph displaying trend information for multiple parameters, all patterns linked to each parameter will be loaded. Additionally, hovering over the multivariate pattern will highlight the specific parameters belonging to that pattern.
icon. When you access a trend graph displaying trend information for multiple parameters, all patterns linked to each parameter will be loaded. Additionally, hovering over the multivariate pattern will highlight the specific parameters belonging to that pattern.
Our new subscription-based pattern matching feature provides you with real-time updates on the trend graph whenever you create, edit, or delete a pattern. No more need to close and reopen the graph to view changes. Instead, witness new occurrences of the pattern as they unfold.
In the example below, you can see a DataMiner user add context to the CPU load of their Elasticsearch process. The multivariate pattern they’ve added shows up instantly on the graph. The related parameters are also loaded, revealing a spike in the SLAutomation process. Both spikes can be attributed to a running script. Any new similar spikes appear without having to refresh the graph, and are given the same dark orange label that says “script running”.
Want to read more about pattern matching?
You might also like
BLOG
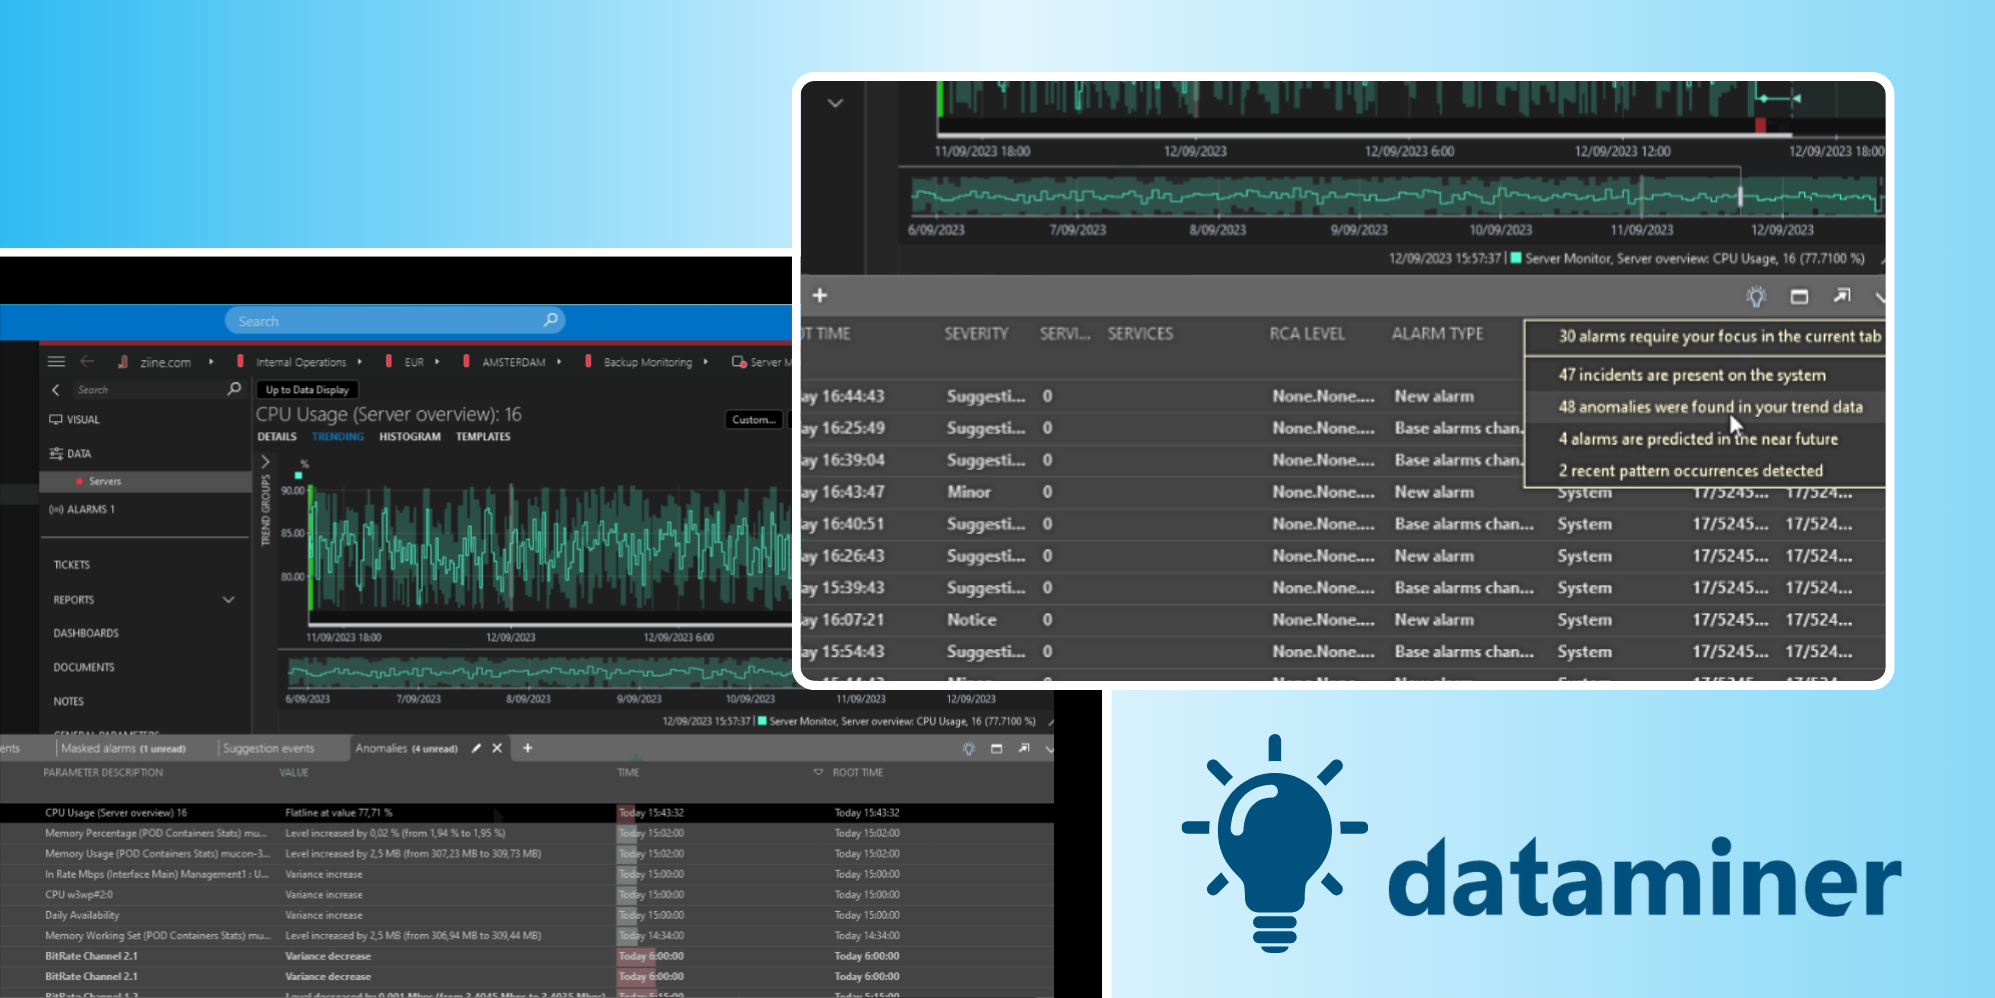
Alarm Console light bulb feature: Use insights to keep an overview of your system
Is your operation becoming increasingly complex and challenging to manage? Are you unable to keep track of everything happening within your operation? With DataMiner 10.3.10, the power of insights 💡 is here to lend you a helping hand.
BLOG
Using the power of insights 💡for your investigations
Tired of time-consuming investigations? DataMiner 10.3.8 is here to provide you with insights based on learned relations between parameters within particular timeframes. This new release is sure to enhance your data analysis experience and decrease time required for investigating issues.