Rates, and particularly bit rates, are in many scenarios crucial pieces of information for the end user. Unfortunately, data sources don’t typically report rates directly. Instead, they report counters. And it’s up to you as a developer to calculate the bit rates based on those counters.
However, rate calculations come with a few pitfalls that can lead to incorrect results if not handled properly. But handling things properly is no guarantee of success either, as some inaccuracies might still occur. This post aims to uncover the pitfalls associated with rate calculations, explain how you can successfully tackle them, and clarify why some inaccuracies might still occur.
Class Library Helper
The Class Library is a great way to make rate calculations without having to worry too much about the pitfalls. That’s because it introduces “helper classes”, which transparently handle most of the rate calculations for you.
Where to find the Class Library?
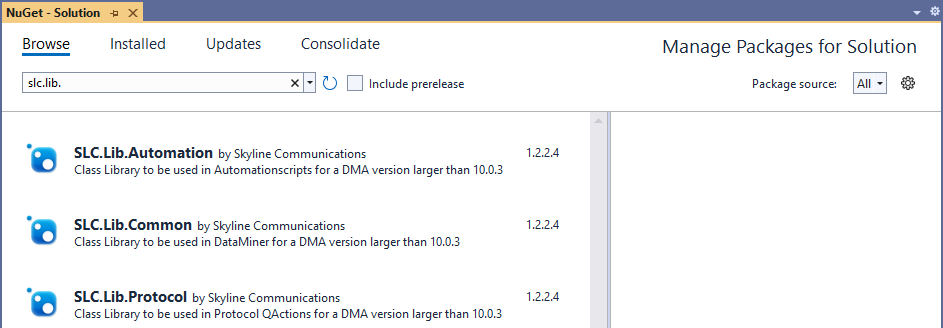
The Class Library is currently embedded in DataMiner Integration Studio (DIS). In the near future, we aim to make it available as NuGet packages in the NuGet store:
How to use the Rate Helpers API
Rate Helpers
Helper classes come in all shapes and sizes. Depending on the use case (i.e. type of counter received from the data source, type of timing information available, etc.), you need to pick the appropriate helper class. Fortunately, they all work very similarly. Let’s take a look at how the “rate helper” class is used:
        // Get buffered data and make a helper instance from it
        string bufferedData = Convert.ToString(protocol.GetParameter(Parameter.counterrateondatesdata));
        Rate32OnDateTime rate32OnDatesHelper = Rate32OnDateTime.FromJsonString(bufferedData, minDelta, maxDelta);

        // Calculate rate
        uint counter = GetNewCounterFromDataSource(protocol);
        double rate = rate32OnDatesHelper.Calculate(counter, DateTime.Now);

        // Save results and buffered data
        Dictionary<int, object> paramsToSet = new Dictionary<int, object>
        {
            { Parameter.counter, counter },
            { Parameter.counterrateondates, rate },
            { Parameter.counterrateondatesdata, rate32OnDatesHelper.ToJsonString() },
        };

        protocol.SetParameters(paramsToSet.Keys.ToArray(), paramsToSet.Values.ToArray());
SNMP Rate Helper
“SNMP rate helpers” are basically wrappers around the above-mentioned rate helpers, containing some extra logic regarding the processing of SNMP delta values (i.e. timing information). Note that the concepts “SNMP delta”, “minDelta” and “maxDelta” are explained in more detail further on in this post.
For example:
        // Build SNMP Delta Helper
        SnmpDeltaHelper snmpDeltaHelper = new SnmpDeltaHelper(protocol, GroupId);

        // Get buffered data and make a helper instance from it
        string bufferedData = Convert.ToString(protocol.GetParameter(Parameter.counterratedata));
        SnmpRate32 snmpRateHelper = SnmpRate32.FromJsonString(bufferedData, minDelta, maxDelta);

        // Calculate rate
        uint counter = GetNewCounterFromSnmpParam(protocol);
        double rate = snmpRateHelper.Calculate(snmpDeltaHelper, counter);

        // Save results and buffered data
        Dictionary<int, object> paramsToSet = new Dictionary<int, object>
        {
            { Parameter.counter, counter },
            { Parameter.counterrate, rate },
            { Parameter.counterratedata, snmpRateHelper.ToJsonString() },
        };

        protocol.SetParameters(paramsToSet.Keys.ToArray(), paramsToSet.Values.ToArray());
An important note here is that the SNMP delta feature will always return the delta between 2 consecutive group executions (as opposed to “2 successful retrievals of counters”).
This means that, in case of group executions timing out, you need to retrieve the SNMP delta values, buffer them, and add them up until the next successful polling cycle. This is also the case for retries: for every single retry, you need to retrieve the delta values, buffer them, and add them up. This can be done the following way:
        // Build SNMP Delta helper
        SnmpDeltaHelper snmpDeltaHelper = new SnmpDeltaHelper(protocol, GroupId);

        // Get buffered data and make a helper instance from it
        string bufferedData = Convert.ToString(protocol.GetParameter(Parameter.counterratedata));
        SnmpRate32 snmpRateHelper = SnmpRate32.FromJsonString(bufferedData, minDelta, maxDelta);

        // Buffer and sum up new delta
        snmpRateHelper.BufferDelta(snmpDeltaHelper);

        // Save new set of buffered data
        protocol.SetParameter(Parameter.counterratedata, snmpRateHelper.ToJsonString());
SNMP Delta calculations
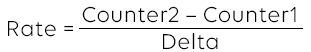
In order to calculate a rate, you need to subtract 2 counter values and divide the result by the time elapsed between those 2 counter values. Throughout this post, we will refer to the time elapsed between 2 counters as “delta”. In graphs, we’ll sometimes use the Greek capital letter Δ (delta).
In an ideal world, the data sources provide you with the exact time stamps corresponding to the retrieved counter values. However, in reality, this is typically not the case, and it’s up to you to calculate the delta value.
You can use the SNMP delta calculation to find out how much time has elapsed between the SNMP polling of the current counter value and the previous one:
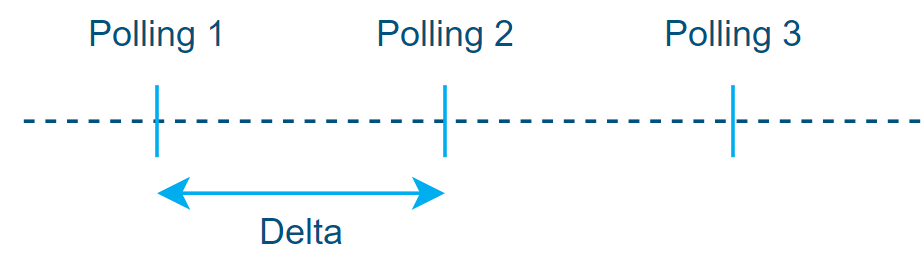
Simplified representation of delta value between polling on a horizontal timeline (left to right).
Now let’s have a look at a similar graph where the timeline is vertical (top to bottom) and where you get some more details about what happens between DataMiner and a data source when the system is polling for counters.
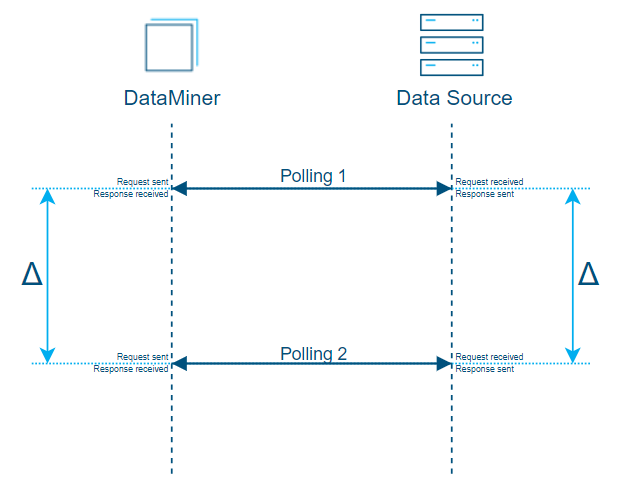
Simplified representation of delta values between polling on a vertical timeline (top to bottom).
The above graph—with its straight horizontal lines—is merely a simplified representation of the polling cycle. So, let’s take a look at a more realistic representation of a polling cycle to better understand why inaccuracies occur and how you can use a best-effort mechanism to end up with the most accurate approximation possible.
As will become clear from the graph below, there are actually 3 steps in polling. And every step can take more or less time than the other steps to be completed.
- Sending the request from DataMiner to the data source (duration mostly depends on the network)
- Processing the request & building the response on the data-source side (duration mostly depends on the data source resources)
- Sending the response from the data source back to DataMiner (duration mostly depends on the network)
If the data source does not provide you with the time stamps corresponding to the retrieved counter values, the only time info at hand is the time when you sent the request from DataMiner and the time when you received the response.
Consequently, the best estimation you can make is by using the middle time between those 2 established time stamps.
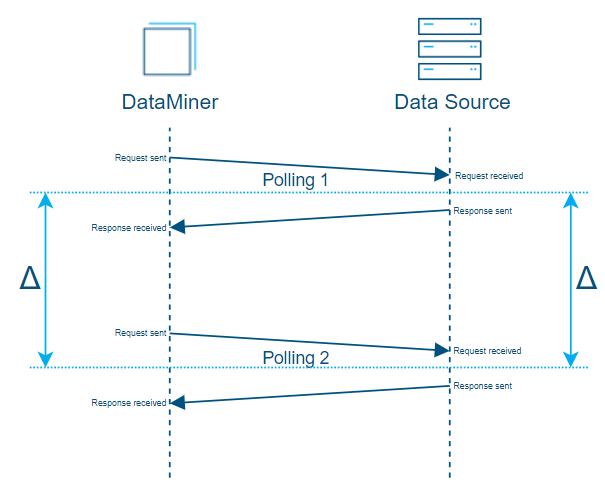
To find the delta value, look for the middle value between the 2 established time stamps (request sent & response received).
Now, in the above graph, the estimate is accurate because the time it took to send the requests is equivalent to the time it took to receive the response.
But in situations where you suddenly get a network congestion in the middle of the process, the time it takes to send the response back could be much longer than the time it takes to send the request (see “Polling 1” in the graph below), or vice versa (see “Polling 2” in the graph below). The estimate would then be less accurate, even though it would still be the best approximation you can make with the data you have.
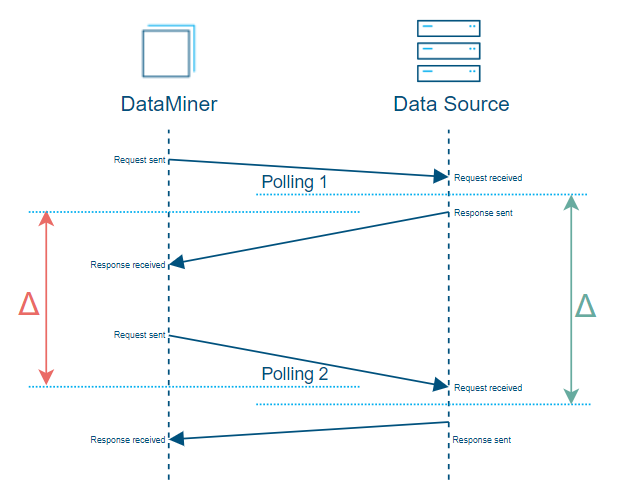
In reality, the time it takes to send the response back could be much longer than the time it takes to send the request (“Polling 1”), or vice versa (“Polling 2”).
All the above examples represent situations where 1 polling cycle happens via a single request and response, which is typically the case when polling standalone parameters or when polling small SNMP tables.
As soon as you want to poll bigger tables, a polling cycle typically consists of multiple requests and responses.
The following graph represents an SNMP table with 3 rows, which is polled row by row via multipleGetNext requests. This is again a theoretical representation where the polling happens in a consistent fashion: all polling requests and responses take the exact same time, leading to an accurate SNMP delta calculation.
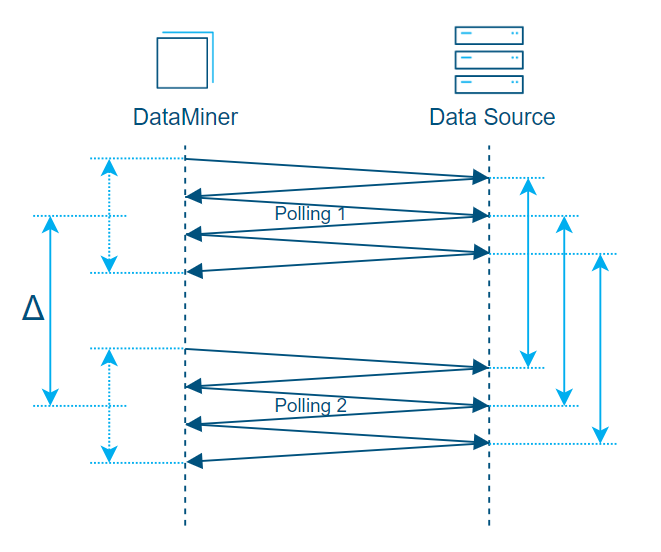
Theoretical representation of polling an SNMP table via 3 SNMP requests where all polling happens consistently.
Now let’s consider a situation where there is a fluctuation in the network efficiency (i.e. inconsistent polling):
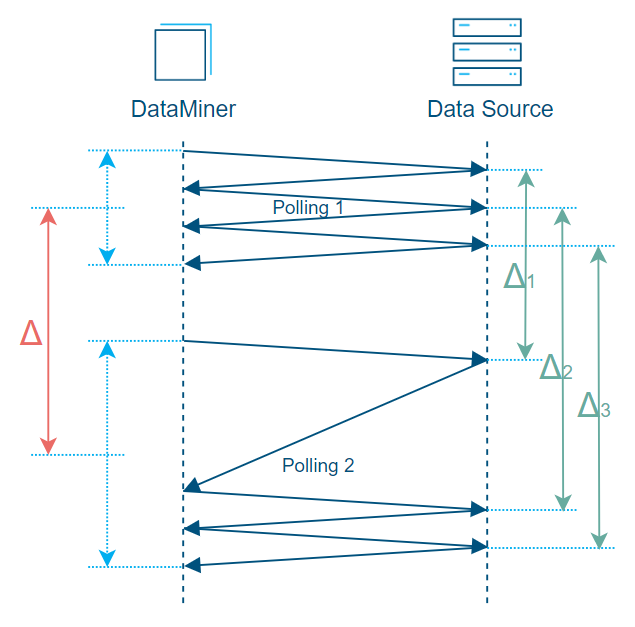
Representation of SNMP table with 3 rows with inconsistent polling. The calculated average delta (Δ) is too big compared to delta 1 (Δ1) and too small compared to delta 2 (Δ2) and delta 3 (Δ3).
In the above graph, you can see that the obtained delta (Δ), which will be used for rate calculations on every row of the SNMP table, is the calculated average of delta 1 (Δ1), delta 2 (Δ2), and delta 3 (Δ3).
In this example, however, the delta (Δ) is too big compared to delta 1 (Δ1) and too small compared to delta 2 (Δ2) and delta 3 (Δ3). This is the approximation that will be made by default by DataMiner when using the SNMP delta feature because it considers delta values on “polling cycle” level. (Note that in a DataMiner protocol “on polling cycle level” corresponds to “on Protocol/Group level”).
However, there is a way to make DataMiner evaluate delta values on “SNMP request” level so that in the above case, instead of providing 1 average delta value, DataMiner will provide 3 delta values, which will be much more accurate. This feature is not enabled by default for the simple reason that it uses more resources.
Keep in mind that in real scenarios, tables typically don’t have 3 rows … but hundreds or thousands of them. And depending on the device capabilities, you will poll these tables row by row—or a few rows by a few rows. (Such a feature of course does not make any sense when polling SNMP tables by column(s).)
Fortunately, you can easily enable this feature yourself on “Protocol/Group” level from within the protocol QActions code. Here is an example of code, running at the startup of an element, that uses a static method from the SnmpDeltaHelper class from the Class Library to configure the SNMP delta tracking method for a given group (1000). It depends on a user configuration made available via a parameter named “Streams Rate Calculation Method”.
    // Every restart of an element, the method is defaulted back to "Fast" by DataMiner so we only need to change it if we expect 'Accurate'
    CalculationMethod rateCalculationsMethod = (CalculationMethod)Convert.ToInt32(protocol.GetParameter(Parameter.streamsratecalculationsmethod));
    if (rateCalculationsMethod == CalculationMethod.Accurate)
    {
        SnmpDeltaHelper.UpdateRateDeltaTracking(protocol, groupId: 1000, CalculationMethod.Accurate);
    }
Additional pitfalls and their solutions
Counters update timing
Polling too fast? minDelta!
Behind the scenes, many data sources do not update their internal counters in real time. Instead, they update them at a specified rate, for example, every 10 seconds. If you poll for counters faster than the data source updates its counters and calculate rates right away, you will inevitably end up with rates that are completely off. Let’s illustrate this with an example.
Suppose the data source updates its counter every 30 seconds, has a maximum capacity of 10 units/s, and currently has a stable rate of 8 units/s.
Now if you poll those counters in DataMiner every 10 seconds and calculate rates for every polling cycle based on the previous one, you will end up with a rate of 0 units/s and peaks of 300 units/s every 30 seconds. Those peaks are way over the actual capacity of the data source and may potentially trigger all kinds of undesired alarms.
This is because every 30 seconds, you’ll see a jump of 240 units, and you calculate the rate considering that jump over the last 10 seconds while it actually represents the jump over the last 30 seconds.
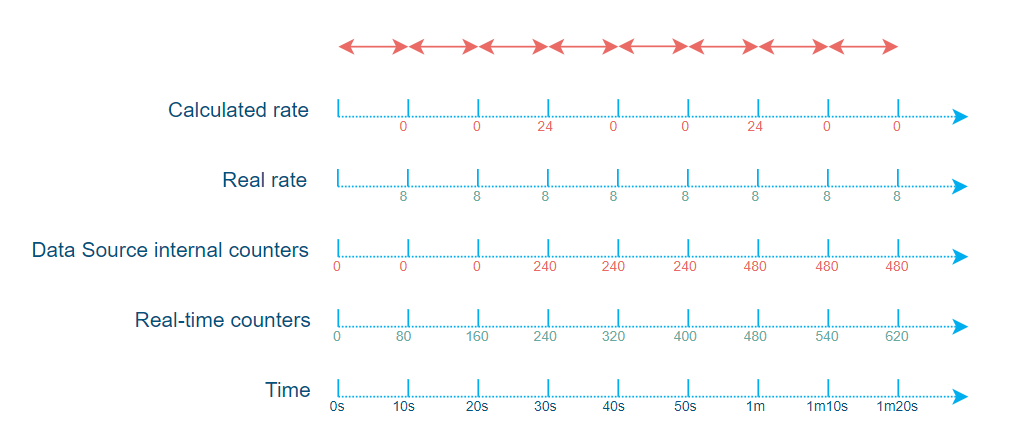
Put differently, you keep calculating rates over the last 10 seconds while the data source updates its counter every 30 seconds, whereas you actually should be calculating rates over the last 30 seconds, at least.
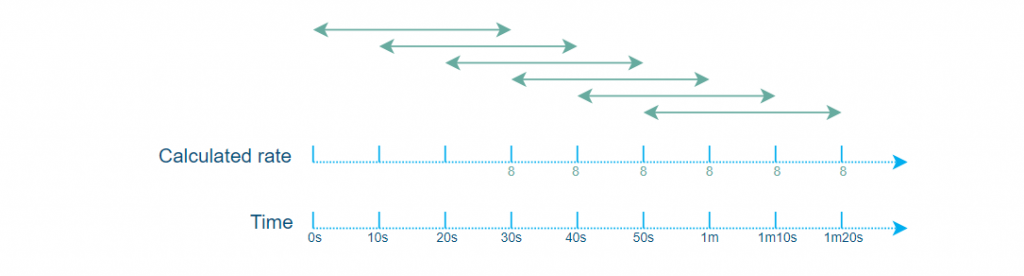
This is where minDelta comes in (see How to use the rate helpers API).
The minDelta will make sure that the rate helper buffers the data until the minDelta time has elapsed, and only then will it calculate the rate and clean up the “older than minDelta time” data.
Note that this does not mean that you can only update the calculated rates every 30 seconds. You do not need to slow down the polling here; you can still poll at whatever rate you want. And since you buffer every retrieved counter, you can still, like in the example, calculate a rate every 10 seconds. The only change is that you now compare the current counter value to the one obtained 3 polling cycles ago.
The minDelta value should be determined by reading the data source documentation with the hope of finding the internal counter’s update rate information and by adding a bit of margin to it.
Unfortunately, that information will not always be available in data source documentation. In that case, you can either try to find it through testing or make it user-configurable by adding a displayed “Min Delta Configuration” parameter to your protocol.
Polling too slow? maxDelta!
Polling too slowly is an issue that is much less likely to happen, but it’s still very valuable to know it exists.
When the internal counter of a data source reaches its maximum value, the counter will wrap around, meaning it will start counting up from 0 again. (Wraparounds are explained further in this post). This does not mean you need to reset your buffered data and wait for the minDelta to be reached again before you can recalculate a rate. Despite the wraparound, you can still calculate the difference between the 2 counters. However, you don’t really have a way of knowing if the counter wrapped around multiple times between 2 successful polling cycles. And if that were the case, your rate calculation would be completely off.
This means that if you poll too slowly or if you’ve had consecutive timeouts for a long period of time, you can’t calculate a rate by comparing the counters of those 2 very distant counter measurements. And this is where maxDelta comes in (see ‘How to use the rate helpers API‘).
This maxDelta will make sure that you drop counters from your buffered data that would be too old to be reliable and never use them for rate calculations.
The maxDelta value is determined by comparing the maximum capacity (i.e. the maximum rate that can be handled by the data source) against the maximum value of the internal counter in order to determine how long it would take for a full wraparound to happen.
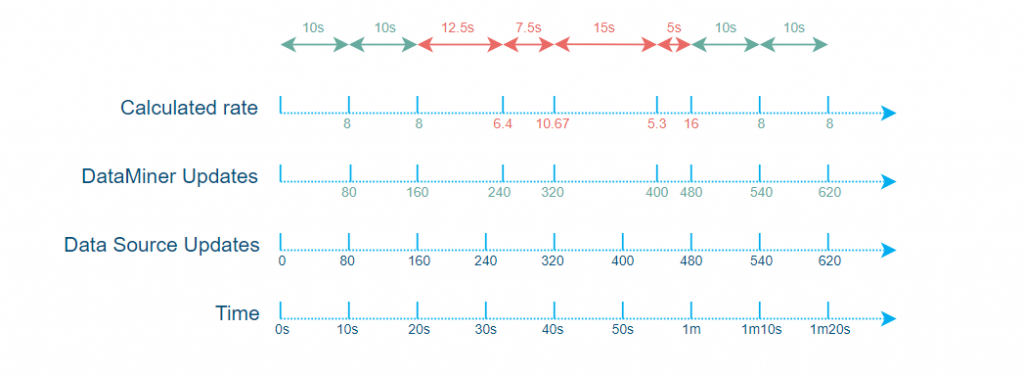
Busy SLProtocol thread
Let’s say your data source updates its internal counters every 10 seconds sharp. In order to get perfect rate results, you would also have to poll those counters every 10 seconds sharp. However, depending on the load on the DataMiner Agent and more specifically on the SLProtocol thread used for polling those counters, there might be a deviation from the ideal situation of polling every 10 seconds sharp.
This can quickly cause inconsistencies in the rate calculations: the delta values will be disparate while the counters will remain consistent (because the counters in the data source are updated every 10 seconds and not in real time).
Note that in this example, we are deliberately omitting the minDelta feature to focus on the possible issues related to the “busy SLProtocol thread”.
Now, let’s focus on the more technical side of why delta discrepancies may appear in a busy SLProtocol thread.
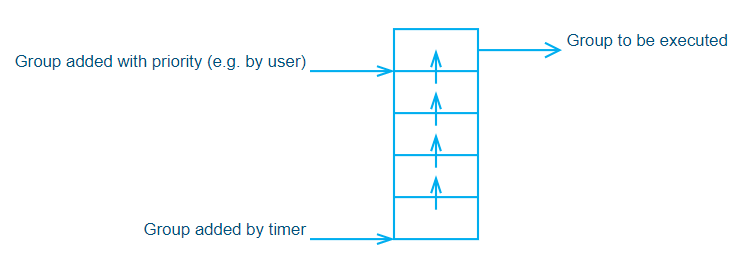
In a protocol, when a 10-second timer is defined, the timer thread will fire every 10 seconds sharp (unless the timer contains work that takes up more than 10 seconds to finish). However, this doesn’t mean that the group will execute right away. It will first be added to the group execution queue and processed by the SLProtocol thread.
By default, there is only 1 SLProtocol thread per DataMiner element and each SLProtocol thread has its own group execution queue. Depending on how busy the SLProtocol thread is (e.g. the amount of work pending in its group execution queue) when the timer fires, there might be a smaller or bigger delay before the polling group actually gets executed.
Also note that timers will always add the polling groups to the end of that queue while there are means in the protocol code to add groups higher up in the queue. This is used, for example, to prevent a user from having to wait too long before an action they manually triggered happens. Such manually triggered actions are typically prioritized for a better user experience. This means that if a user is triggering a lot of actions on the SLProtocol thread, the groups added by timers might take much longer before getting executed, causing discrepancies in the counter’s polling rate.
The following graph represents the group execution queue in a simplified form.
You can mitigate the above-mentioned discrepancies by creating an additional SLProtocol thread that is dedicated to polling counters.
That being said, we wouldn’t advise doing this systematically because this could quickly result in too many threads in the system, causing too much resource usage. Instead, we recommend that you only apply this method when the rate precision is critical and when you know up front that the default SLProtocol thread will see high usage (e.g. when the end user is likely to trigger the polling of a very big table with priority).
Wraparounds
Whenever a counter reaches its maximum value, it will wrap around, meaning that it will start counting up from 0 again.
This does not mean, however, that you need to reset your buffered data and wait for the minDelta to be reached again before you can recalculate a rate. Despite the wraparound, you can still calculate the counter’s difference.
However, it is possible that this might need to be treated differently depending on the counter type (UInt16, UInt32, UInt64, etc.). Note that currently we only have rate helpers for UInt32 and UInt64 counters because those are most typically used and we have not yet come across a situation where rates had to be calculated based on any other types of counters.
- Subtracting 2 UInt32 implicitly returns a UInt32 and handles wraparounds nicely.
- Subtracting 2 UInt64 implicitly returns a UInt64 and handles wraparounds nicely.
The only thing you have to make sure of is that the subtraction is “unchecked“, meaning that it won’t throw any exceptions in case of wraparounds. In DataMiner, code is compiled without the CheckForOverflowUnderflow option, so you don’t really have to worry about this when working on protocols and/or Automation scripts.
However, when working with other types, you need to be a little bit more careful:
- Subtracting 2 UInt16 implicitly first converts both values to UInt32, subtracts them, and returns an Int32, meaning that wraparounds won’t be handled properly. In such a case, an explicit cast to UInt16 would be required for the wraparound to be handled properly.
Data source reboots
In case of a reboot of the data source, the counters will start again from 0. This means you have to make sure such reboots are detected and reset your buffered data in order not to consider this as a normal wraparound, which would result in reporting incorrect rates.
You can reset your buffered data simply by setting the internal rate data parameter to an empty string.
    // Reset buffered data
    protocol.SetParameter(Parameter.counterratedata, "");
The right way to detect a data source reboot obviously depends on the data source itself. However, for SNMP, the generic SNMP parameter sysUpTime (1.3.6.1.2.1.1.3) can be used.
Overflow exceptions
Overflow exceptions can happen in many situations, not only in the scope of counters and rate calculations. However, because of the nature of counters (i.e. always going up) and rate calculation, it is just more likely to happen and have an impact here.
When you poll UInt64 counters over SNMP, for example, those counters first end up in a parameter defined in a protocol. In DataMiner, such a parameter can only be of type “String” or “Double”. You will typically opt for the “Double” type in this case. DataMiner will then first convert the UInt64 counter to a double, which comes with small inaccuracies. Such an approximation is very much negligible, though, and won’t cause any noticeable inaccuracy in the final rate calculations.
However, in cases where the retrieved counter is very close to the maximum value of a UInt64, like in this example, it might happen that the inaccuracy causes a value slightly higher than the maximum value for the UInt64 type. When you then convert that value back to a UInt64 in a QAction in order to make your rate calculation, the conversion will result in an OverflowException.
To counter this, we have added a SafeConvert class to our class library. This safe converter will first check if the value is bigger than, in this example, the maximum value of UInt64 and in that case, return this maximum value. Again, you should not be afraid of this inaccuracy here as it will be very negligible and will only return a value closer to reality, since it all started from a counter that almost reached the maximum value of the counter type (in no case bigger).
    double counterAsDouble = Convert.ToDouble(protocol.GetParameter(Parameter.counter));
    ulong counter = SafeConvert.ToUInt64(counterAsDouble);
Note that for the sake of clarity, the above piece of code is made up of 2 statements, while in a real scenario this would probably be implemented in 1 statement to avoid the unnecessary counterAsDouble variable.
Polling vs subscriptions
Most of the above-explained pitfalls, approximations, and inaccuracies are caused by counters on the data-source side getting updated at a certain rate while you are polling for counter updates without knowing exactly to what timing the counters you get correspond.
There are 2 situations, however, where all this can be avoided. Unfortunately, those are often not supported by data sources:
- When a data source can also provide you with precise timing info corresponding to retrieved counters.
- When a data source allows you to subscribe to counters and then sends you counter updates precisely when they happen.
These options should obviously be preferred when possible.
great article, thanks Simon!
Nicely explained! Something you’d think is a simple calculation at first sight is way more complex than you’d think.
Hi folks,
In the meantime, the rate helpers API has been extracted from the old Class Library and has been released into following NuGet packages:
– Package to be used when counters data is polled from a DataMiner snmp connector: https://www.nuget.org/packages/Skyline.DataMiner.Utils.Rates.Protocol
– Package to be used in any other circumstances: https://www.nuget.org/packages/Skyline.DataMiner.Utils.Rates.Common
We have also released 2 demo/examples on how to consume those helpers:
– https://github.com/SkylineCommunications/SLC-C-Example_Rates-SNMP
– https://github.com/SkylineCommunications/SLC-C-Example_Rates-Custom
And we also released a good starting point for any SNMP connector that already includes interfaces tables and corresponding rate calculations: https://github.com/SkylineCommunications/SLC-C-Example_SNMP-Base