The DataMiner documentation is continuously growing and improving. That’s why from time to time we like to provide you with a summary of all things new in the DataMiner Docs.
Here’s a quick overview of the changes we’ve done to the documentation for DataMiner 10.3.7:
- In the Monitoring app, a new pencil icon enables direct parameter editing, while the new trend graph icon grants one-click access to the trending page.
- A convenient update to DataMiner Dashboards and Low-Code Apps has been introduced that automatically configures the label and segment size of a pie & donut chart and the label and bars of a column & bar chart when a query has been added to the component.
- In the Resources module, you can now easily duplicate a resource.
But those are not the only things we’ve changed recently!
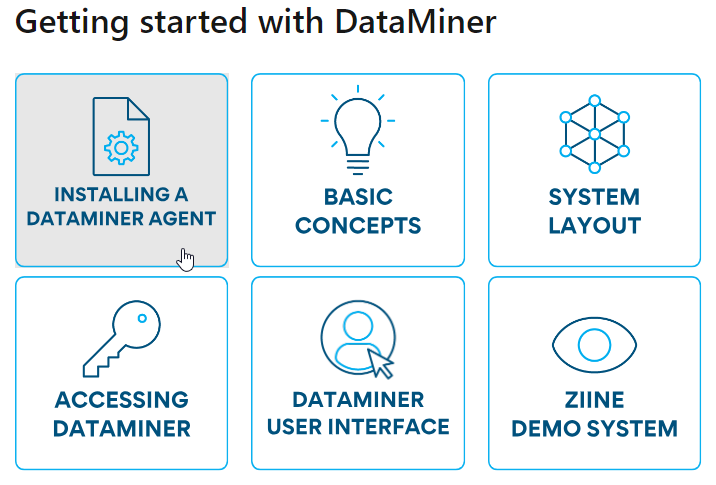
- We’ve given several main pages in the DataMiner Docs a thorough makeover. Using our very own Skylicons, we’ve added clickable tiles that will make navigating through the documentation easier than ever before. Take a look: Getting started with DataMiner, Operator guide, Administrator guide and DataMiner functions.
- Additionally, the documentation about the DataMiner Dashboards app and Low-Code Apps have been combined under Dashboards and Low-Code Apps. We brought these two topics together to make it easier to find information applicable to both modules.
- Our known issues have also been revamped. They have not only been organized by DataMiner version, but are also separated into current and resolved issues.
- And lastly, we’ve completely restructured the databases documentation. Interested? Read all about the changes we’ve made in our recent blog post!
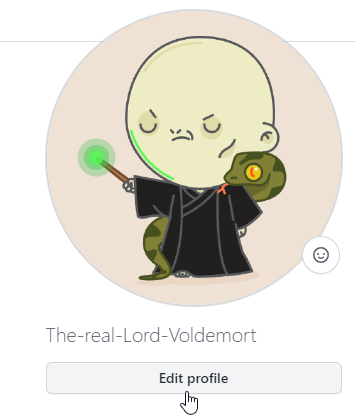
Add your name on GitHub
We’re amazed by the number of people that are constantly contributing to the DataMiner Docs by creating pull requests. All valuable additions are rewarded with our highly coveted DevOps Points. However, to award points, we need to know who’s contributing. Make sure to add your real name to your GitHub profile so that – if you are signed up to the DataMiner DevOps Professional Program – we can get you your hard-earned DevOps Points.