Flow monitoring and analytics
Whether you are an ICT media operator, a broadcaster, or a broadband operator, the number of flows in your operation has been growing exponentially, and so has the number of services, delivery platforms and technology evolutions, such as SMPTE ST 2110 for media, and Converged Interconnect Networks (CIN) for broadband services. The vast majority of flows are IP-based, of course.
The DataMiner Flow Monitoring solution creates full visibility on the IT, broadband and media flows across any network. The platform pinpoints the root cause of any issue you might come across with your unicast or multicast traffic, independently of the transport layer. Issues may be caused by wrong configurations, network failures, oversubscriptions, security breaches, unexpected planned maintenance, and much more. DataMiner provides a holistic view on your operations and your service flows, from source to destination, end to end.
Look at it from all angles
When monitoring flows in an operation, more is involved than just the actual flows (as is). An operator needs context. Context is a view on what exactly each of those flows are on the one hand, and what flows are to be expected in the future on the other hand, as this may very soon affect the running flows.
DataMiner covers this first aspect by allowing operations teams to use metadata such as flow names for single flows or any group of flows. Those labels can be entered manually, but they can also be extracted from external systems, like third-party CMDBs, SDN controllers, provisioning databases and service catalogs, broadcast controllers, etc.
To tackle the second aspect, DataMiner provides LSO-driven documentation. This means that operators can access views for the situation as is (i.e. actual flows running on the network), but also as planned, LSO provisioned, etc. This enables operators to detect differences between the planned, engineered and actual configuration of the network. Together with the DataMiner Flow Engineering App, this enables planning and operations to take into account bandwidth that is already reserved for planned services in the future.
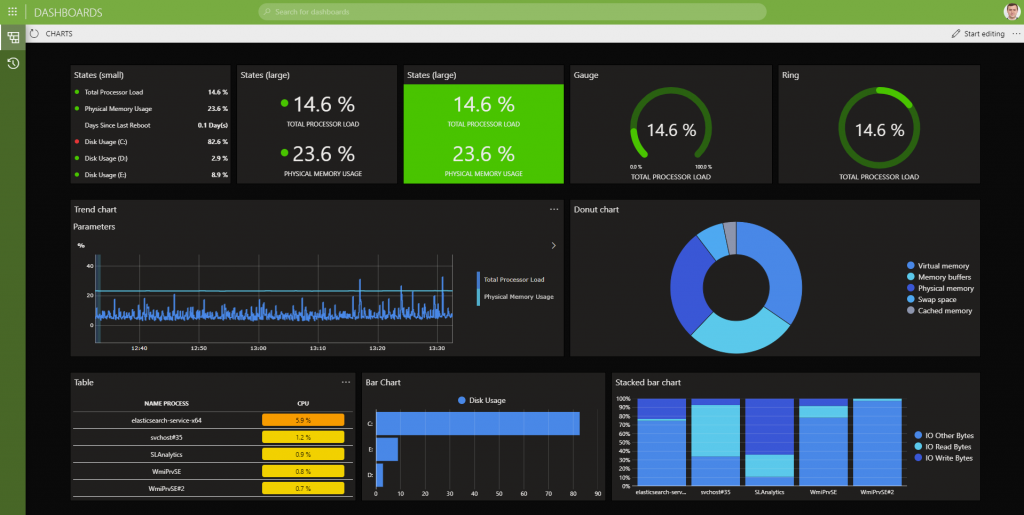
DataMiner presents all contextualized flow information in any visualization format needed. Based on the DataMiner Connectivity Framework (DCF) database, all kinds of dashboards can be configured with the click of a mouse. Furthermore, there are of course the standard east-west and north-south views in our Cube app, and all information can be provided via API through our DataMiner GQI (Generic Query interface).
With DataMiner you can easily create dynamic network topology views, including switches and network edge devices. This can be a physical network topology automatically extracted via LLDP, as well as any Layer 2/3 mapping, e.g. to filter out a certain VLAN or multicast stream.
Furthermore, visual layers can be added to show user-definable metrics and KPIs, like link bandwidth utilization, SFP DOM metrics, and lists of multicast streams per interface. In summary, DataMiner lets an operator or administrator create real-time ICT-centric dashboards, featuring any KPI, like top connections, top protocols, top talkers, or anything else you could think of.
Leave no data behind
As it is essential to have a complete view on your flows, which often run across a lot of different types of devices, it is paramount to be able to integrate every data source into your flow monitoring setup. DataMiner does this in a number of different ways.
Any product, any vendor, any protocol
With DataMiner, an operation is presented with unrestricted possibilities to integrate equipment. DataMiner features a deep integration with any vendor’s network equipment, interfacing directly with each network router and switch, BGP router, etc., via industry-standard or rich vendor-specific APIs. DataMiner connectors often use a mix of different protocols and technologies, such as a combination of SNMP, a RESTful API and Syslog, to get the most out of any product.
Whereas networks rely on IP transport in many cases, DataMiner also supports other transport protocols and physical layers: dark fiber, CWDM, DWDM, SONET/STH, media over SDI and ASI, satellite SCPC RF flows, etc.
Streaming Telemetry
DataMiner also features support for streaming telemetry, allowing for fast updates, and avoiding the loss of intermediate events.
With streaming telemetry, you can precisely define which data should be captured and processed. This is important, as not necessarily every possible parameter from your network infrastructure needs to be monitored. In addition, the amount of data flowing between DataMiner and network switches gets limited this way. Only when metrics are changing, will new data be sent. This makes inefficient repeated polling of the same metrics with the same value a thing of the past.
DataMiner adheres to open standards and specifications. It fully supports OpenConfig. OpenConfig is an informal working group with members such as Google, Microsoft, AT&T and British Telecom. It defines a compiled set of vendor-neutral data models to monitor and configure your network inventory, and it supports get and set methods. The most popular use of OpenConfig is to create on-change subscriptions. DataMiner receives real-time updates only when the value of a metric or parameter changes.
The concept of streaming telemetry is not only used to monitor network infrastructure, it is also a great tool to get an in-depth view into network traffic, showing packet rates, packet error rates, CRC errors, or any other traffic KPI, which is referred to as “network traffic telemetry”.
In addition to OpenConfig, DataMiner also supports other protocols supported by many switch vendors, such as SFlow, NetFlow or JFlow. Flow agents run on the switches and collect sampled or non-sampled data. The latter gets pushed to one or multiple DataMiner flow collectors.
TAP aggregation
TAP aggregation (Test Access Point Aggregation) is when an external device is plugged into the network to gather network data and statistics without compromising network integrity. DataMiner not only monitors your environment but also orchestrates the deployment of TAP aggregation setups.
DataMiner supports your test and measurement workflows: Integrate network protocol analyzers like Wireshark or dedicated media flow analyzers to also decode the compressed or uncompressed video and audio essence, and automate the configuration, execution and results gathering for all test and measurement workflows through DataMiner, with the DataMiner Synthetic Testing App.
Edge devices & controllers
DataMiner not only extracts information about media flows from your switch infrastructure, the DataMiner platform also interfaces with your network edge devices, such as unicast or multicast senders, to constantly check if the sources are streaming on the correct addresses. The same goes for the destinations. For example, it is essential to always check stream presence for redundant inputs (e.g. ST2022-7). The edge devices involved don’t even need to be on premises to achieve this functionality: DataMiner monitors the handover point from public cloud to your network and helps avoid possible issues.
DataMiner also interfaces with CMDBs, SDN controllers, or other external data sources to check for media flows that should be present but also to detect those flows that should not be available in the network, thereby securing your network from the ground up.
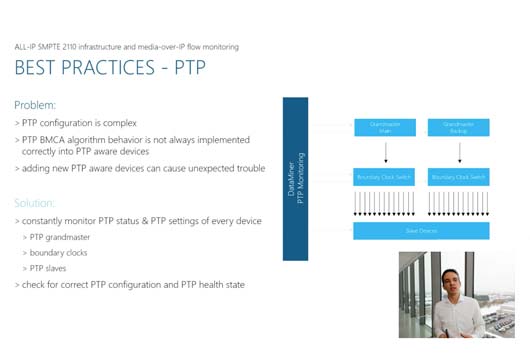
PTP management: if the clock fails, the network fails
Transporting and switching media flows in the network requires perfectly synced media flows at all times. Precision Time Protocol (PTP) is the de-facto standard to sync real-time unicast or multicast flows.
The DataMiner PTP app collects and correlates data from each PTP node and interfaces with third-party PTP network analyzers to achieve true 360° real-time PTP observability. The app immediately informs operators about network degradations or any PTP state changes, originating from GNSS (global navigation satellite system) down to every PTP follower device, to ensure a stable and reliable PTP environment. 24/7 in-depth PTP monitoring, keeping track of the PTP configuration, behavioral analysis and change detection, performance tracking of every single PTP node over time … it has all become a must-have. This is exactly what the DataMiner PTP app does for you.
Full network layer & ICT stack management
DataMiner extracts a variety of metrics and KPIs from all network layers.
- Layer 1: Physical layer: Monitoring of physical fiber interfaces, as well as any SDI, ASI or RF device.
- Layer 2: Network layer: VLAN/MPLS information.
- Layer 3: Transport layer: IP routing tables to extract unicast or multicast routing or IGMP tables, including cloud connect.
- Layer 4: Application layer: BGP, 2022-7 switches, edge gateways, TS-mux, IRDs, etc.
Moreover, DataMiner not only monitors and controls your network infrastructure but also manages your full ICT stack including servers, operating systems, virtual machines, containers and all your media applications and ICT platform services.
Be proactive and see the bigger picture
Some information can be gathered by just reading out devices, but to be sure to have a complete view on where the flows are in a system, more advanced techniques are required. DataMiner does proactive testing and forecasting to give your operator an edge in diagnosing possible problems.
Use DataMiner AI-augmented operations such as forecasting, anomaly analysis and pattern detection to proactively identify problems in the network before they arise.
In the same way, the DataMiner Synthetic Testing app also supports proactive networking checks. Those can be simple things like pinging your edge devices or automatically performing a traceroute to track the pathway of IP packets.
Across the chain, across the stack: flow types
With DataMiner, an operator can drill down through all layers, providing information on every aspect of the flow at hand, from service to physical level, all integrated into one system. This is true north-south integration.
The north-south integration is complemented with east-west integration. In most operations, network flows will not exist throughout the chain as one single format. You might start with an SDI signal, which is transformed to an IP signal (perhaps in the SMPTE ST2110 format) over the network, only to be multiplexed to a transport stream at the receiving end. DataMiner will not only transparently monitor every stage of this flow, including SDI, IP and ASI, it will track the individual flows as well as the multiplexed ASI signal over all layers. Here DataMiner will create signal or service groups, grouping together 2110 elementary flows as well as ASI bundles.
Furthermore, DataMiner features reverse engineering across all layers, to connect information from MC tables, UC tables, VLANs, but also Kubernetes PODs or cloud connect applications, across the ICT stack back to the service views.
This kind of full-stack transparency is what makes DataMiner the most complete environment for monitoring data flows of all kinds.
Performance
DataMiner provides all this functionality 24/7 and ad hoc, meaning there are no gaps in your monitoring, and all information is real-time and easily accessible, at any point in time.
24/7 flow monitoring: Get instant alarms and notifications when a stream is missing at a destination. Cross-check the control or scheduling system against stream presence at each destination for thousands of streams concurrently.
Ad-hoc flow troubleshooting: DataMiner provides an easy-to-use-tool to troubleshoot and identify the root cause of any media flow issue. It crawls through the network from a signal source to the destination and interfaces with all supporting data sources to achieve a “single pane of glass” user interface.
Integrate and Collaborate: OSS integration
DataMiner supports all layers of network monitoring and support, up to the business layer, offering a full OSS/BSS integration and allowing for features such as SLA management. This allows you to overlay failures and errors with planned maintenance, extra ticket info, and external job schedules. It also provides context to detect the unexpected and monitor the expected. Your operators will know which flows are supposed to be down, and the alarms can even be masked when planned maintenance is taking place. Operators will also know which flows are not supposed to be in the system, which provides an additional level of security to your operation.
Last but not least, an effective operation thrives on collaboration. That is why DataMiner allows you to share dashboards and controls with your colleagues inside or outside your operation with cloud-connected DataMiner Systems, enabling efficient collaboration workflows.
Learn more about DataMiner for IP Flow Monitoring and Analytics
Please note that you need to be logged in to access our video library: in the top corner of the screen, click LOG IN and authenticate yourself with your corporate email address.
Webinar
All-IP SMPTE-2110 infrastructure and media-over-IP monitoring
YOU'LL LEARN
- what is required to achieve a 360° end-to-end view on your video and audio flows
- best practices for PTP monitoring
- how to analyze media flows efficiently
Blogpost
Monitoring high-traffic networks the easy way
Your network is constantly busy as multiple protocols are traveling across it. But do you know anything about these protocols? How do they compare percentage-wise? How much is HTTP and how much DNS? Who are the biggest talkers or listeners?
Getting to the bottom of all this is one of the most intriguing aspects of network management. In this blogpost we’ll show you how easy it really is to collect all this information thanks to export protocols.
Expert hub
Streaming telemetry, flow monitoring, and network traffic flow management are technologies used to find out exactly what's going through your network. Check out our expert hub to get insight in different aspects and to find out how streaming telemetry and flow monitoring are used in different industries.
Let's talk about your project
Are you interested to know if this standard solution also offers possibilities for your project? You can either ask your question right here on our Dojo community. Or, if you prefer the more personal touch, you can also contact your local sales representative. Either way, our DataMiner experts will be happy to discuss all the possibilities with you, down to the smallest detail.