I can see the service that is monitoring the 28 streams.
I want to alarm all 28 individual streams and monitor the bitrate but seem to not be able to access that.
As this question has now been open for a long time and there has been no further reaction from you, I will now close it. If you still want more information about this, could you post a new question?
Hi Noor,
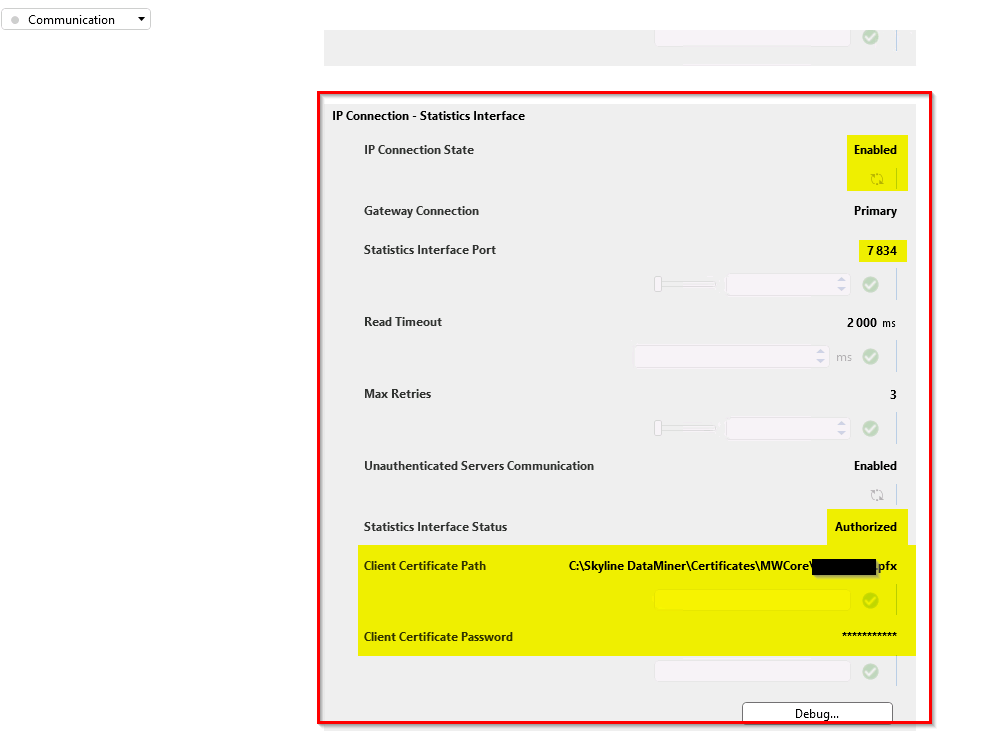
The Statistics data are available via the Statistics/Telemetry Interface other than the HTTP. You need to provide the client certificates and enable the Statistics interface. Once the Statistics Interface is Authorized, you will be able to get and monitor statistics data including bitrates.

You also need to Enable Statistics Information on the Cluster Servers table.

Hi, thank you, I enabled the statistics information on the cluster servers table and it said the Statistics Interface Status is “Athuenticating..” then became Not Authorized
Make sure you provided the correct client certificate path with a valid certificate. If you check the element logging, it will tell you why the Authentication failed.
I see that this question has been inactive for some time. Have you been able to solve this based on Fenta’s answer? If yes, could you select the answer to indicate that this question is resolved?