After installing elasticsearch database on a Linux (Debian) VM and connect it to DataMiner, I have the following errors in my alarm console:

On SLSearch logfile, there are multiple exceptions (where's one as an example):
2022/01/28 13:22:58.610|SLDBConnection|RawCommu nication|DBG|0|206|URL: http://192.168.194.245:9200/dms-alarms/_count
Elasticsearch.Net.ElasticsearchClientException: The remote server returned an error: (404) Not Found.. Call: Status code 404 from: GET /dms-alarms/_count. ServerError: Type: index_not_found_exception Reason: "no such index [dms-alarms]" ---> System.Net.WebException: The remote server returned an error: (404) Not Found.
at System.Net.HttpWebRequest.GetResponse()
at Elasticsearch.Net.HttpWebRequestConnection.Request[TResponse](RequestData requestData)
--- End of inner exception stack trace ---
Response:
{"error":{"root_cause":[{"type":"index_not_found_exception","reason":"no such index [dms-alarms]","resource.type":"index_or_alias","resource.id":"dms-alarms","index_uuid":"_na_","index":"dms-alarms"}],"type":"index_not_found_exception","reason":"no such index [dms-alarms]","resource.type":"index_or_alias","resource.id":"dms-alarms","index_uuid":"_na_","index":"dms-alarms"},"status":404}
2022/01/28 14:22:58.775|SLDBConnection|RawCommu nication|DBG|0|71|URL: http://192.168.194.245:9200/dms-alarms/_count
Elasticsearch.Net.ElasticsearchClientException: The remote server returned an error: (404) Not Found.. Call: Status code 404 from: GET /dms-alarms/_count. ServerError: Type: index_not_found_exception Reason: "no such index [dms-alarms]" ---> System.Net.WebException: The remote server returned an error: (404) Not Found.
at System.Net.HttpWebRequest.GetResponse()
at Elasticsearch.Net.HttpWebRequestConnection.Request[TResponse](RequestData requestData)
--- End of inner exception stack trace ---
Response:
{"error":{"root_cause":[{"type":"index_not_found_exception","reason":"no such index [dms-alarms]","resource.type":"index_or_alias","resource.id":"dms-alarms","index_uuid":"_na_","index":"dms-alarms"}],"type":"index_not_found_exception","reason":"no such index [dms-alarms]","resource.type":"index_or_alias","resource.id":"dms-alarms","index_uuid":"_na_","index":"dms-alarms"},"status":404}
**********
DMA is not using 'root' user to contact ES. It's using another user (named 'elastic') which is part of sudo group, so we don't expect user right settings to be a problem.
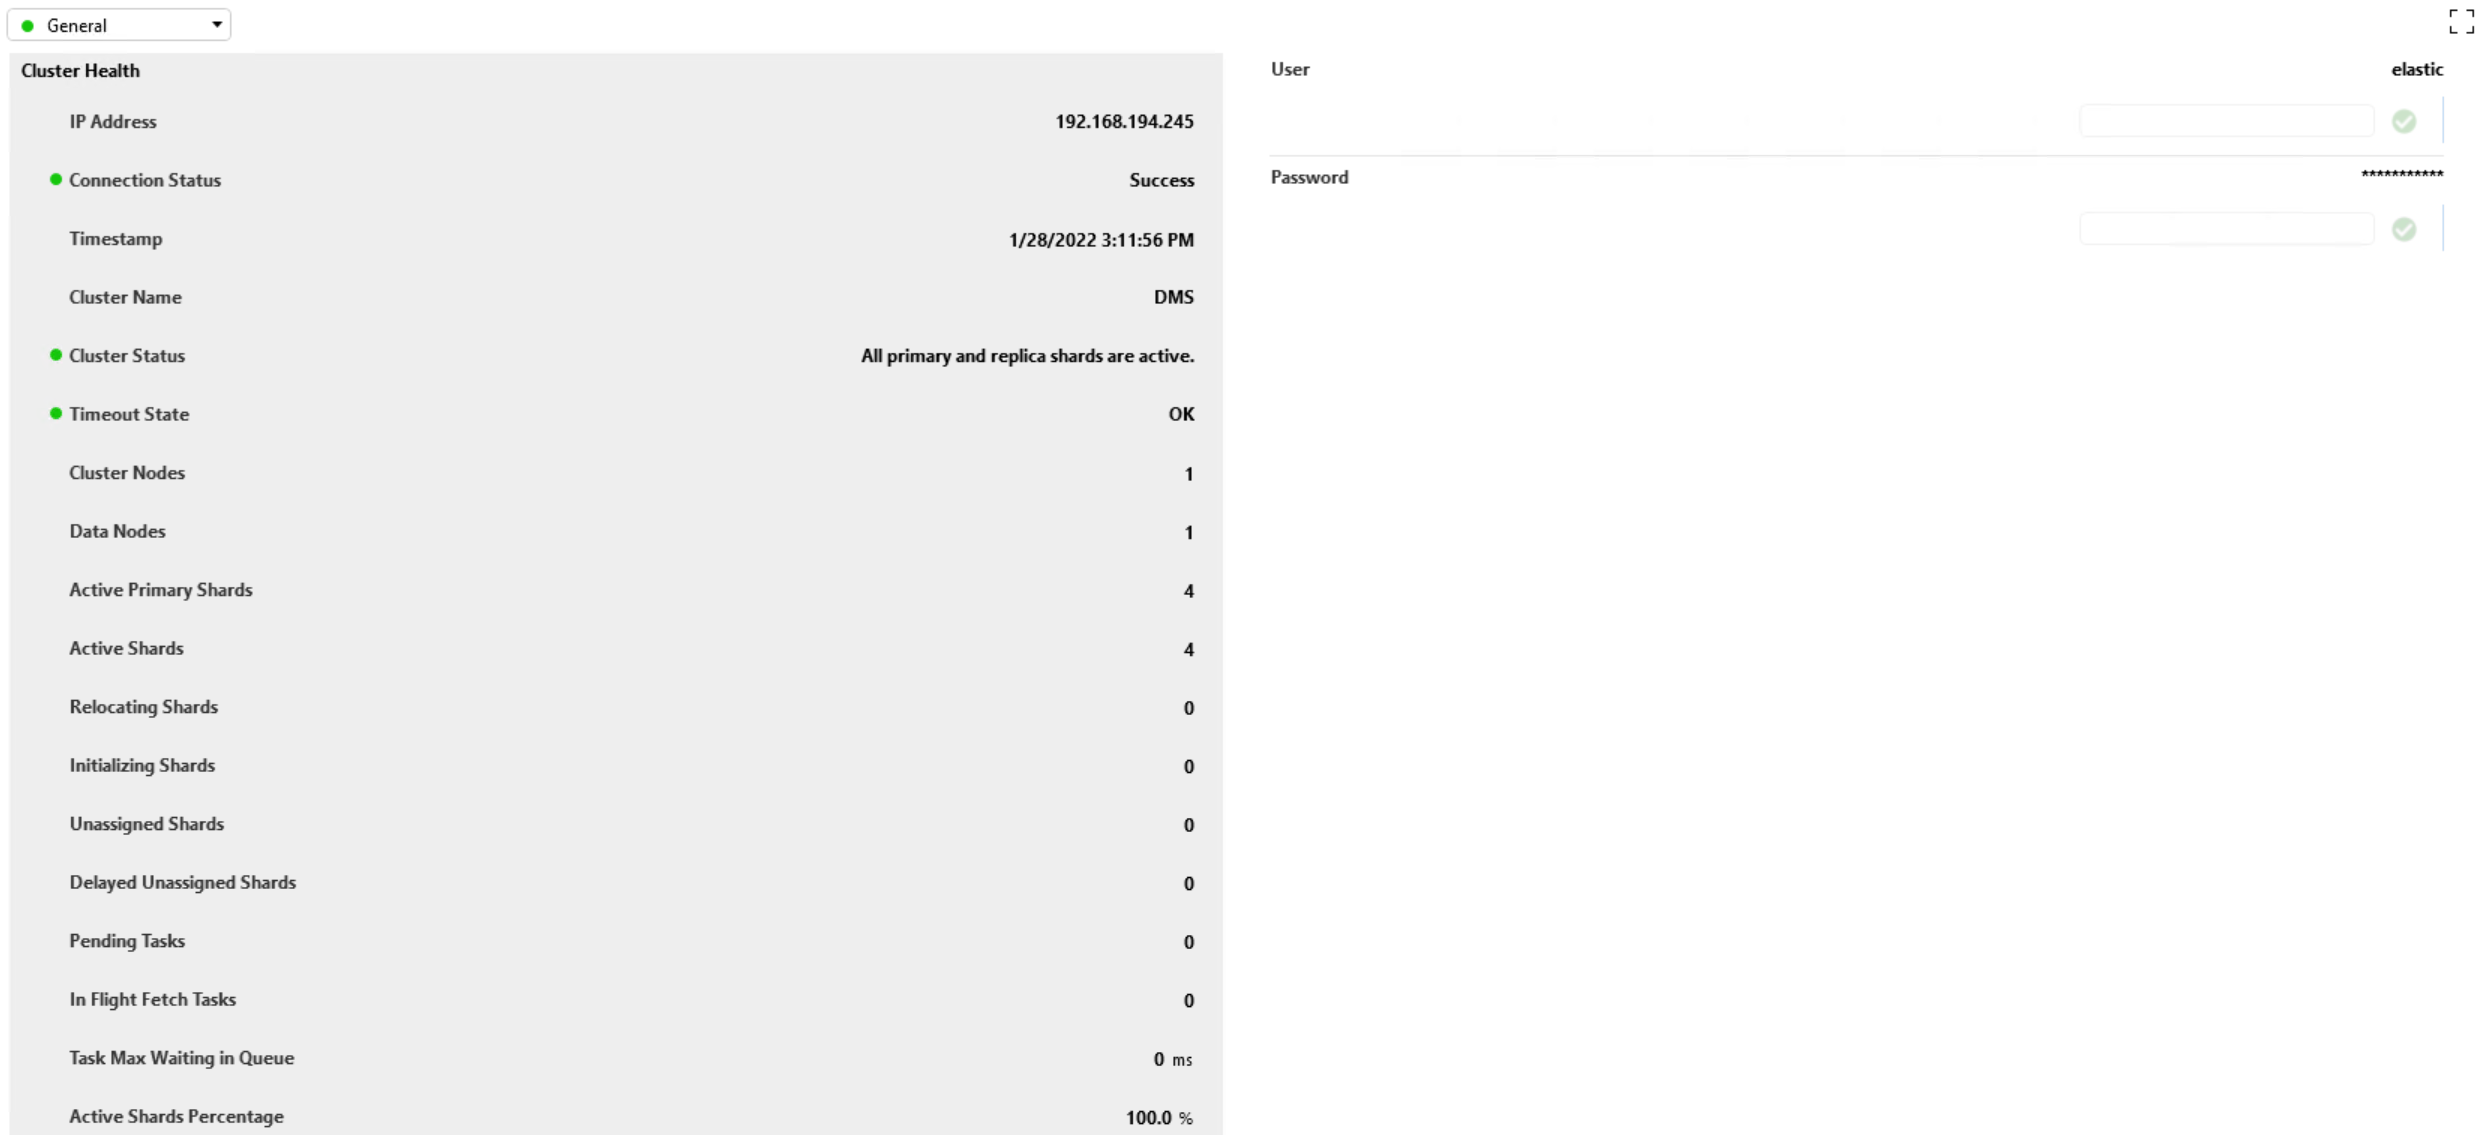
The ES database is reachable to the DMA, as I can see in an element running ElasticSearch Cluster Monitor driver:

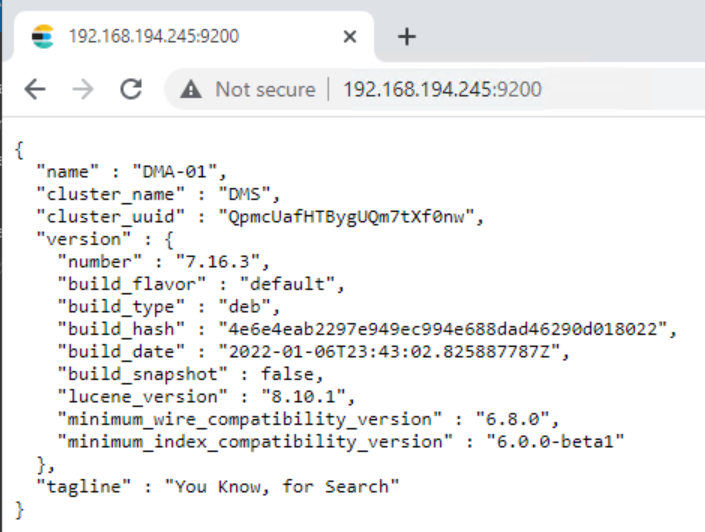
EDIT: Here are some screenshots from browser queries from the Dataminer node to ES database.


What can we do to resolve these errors?
Miguel, we have this
Status: active
Logging: on (low)
Default: deny (incoming), allow (outgoing), disabled (routed)
New profiles: skip
To Action From
— —— —-
2222/tcp ALLOW IN Anywhere
9200/tcp ALLOW IN 192.168.194.246
2222/tcp (v6) ALLOW IN Anywhere (v6)
The best way to detect if there’s an issue is open a browser on your DMA server and go to ElasticIP:9200/ and see the outcome. Also ensure the version is 6.8.x and not 7.x
Thomas, looking to the elasticsearch information from the new screenshots uploaded, could be that the ES version is not compatible with DataMiner?
Hi Bruno,
Seems that you're not running a supported ElasticSearch version as indicated by Thomas.
Below is taken from a Linux node that we have running in the cloud with ElasticSearch version 6.8.22
{
  "name" : "17-0-cloud",
  "cluster_name" : "DMS",
  "cluster_uuid" : "O5Jb7Zj4TC6ybbNwz-TYLw",
  "version" : {
    "number" : "6.8.22",
    "build_flavor" : "default",
    "build_type" : "deb",
    "build_hash" : "71fcb50",
    "build_date" : "2021-12-19T01:10:56.497443Z",
    "build_snapshot" : false,
    "lucene_version" : "7.7.3",
    "minimum_wire_compatibility_version" : "5.6.0",
    "minimum_index_compatibility_version" : "5.0.0"
  },
  "tagline" : "You Know, for Search"
}
After downgrading ElasticSearch to 6.8.23, this is now working fine.
Based on the error, it seems that the DMA is not able to reach the Elastic node. Can you check if the port used by Elasticsearch node is opened?
In case of Linux distro you can check if the port is opened by running the following command:
sudo ufw status verbose
If the status is inactive this means that the firewall service is not enabled.
In case ufw is not installed by default, you could use:
sudo iptables -L
If there are no rules listed, this means that there are no firewall rules blocking the connection from the DMA