Hello,
I would like to have in a dashboard a list of services and their respective alarm status. Also, I want to show only the services that are under a certain selected view.
Is there a way to achieve this? I found that GQI queries allow filtering services but I couldn’t find a filter for the parent view, nor a way to select the current alarm status of the services.
Hi Sebastian,
As Sebastiaan mentioned GQI will be the best option, however currently it is not possible to retrieve the alarm state of a service. I believe that the answer from Jarno can be tweaked a bit to cover your use case. Instead of using the ‘alarm table’ component to display the alarms, we could use the ‘state’ component. This component will show the alarm state of the selected service(s):
Hi Sebastian,
Sounds like a classic use case for GQI. We don’t have all pieces for this puzzle just yet, but we’re already able to list all services in a certain view using the following query:
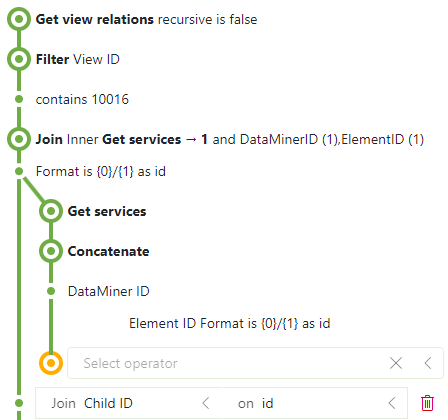
Some explanation:
- We can fetch the view relations by enabling the ‘GenericInterface’ soft launch option. This data source contains a row for each parent-child relation (note that you can also fetch recursively).
- Filtering this data source on the view we’re interested in will contain a row for each item in that view. Note that this contains elements, services and other views.
- We can join this result onto the services data sources (note that we still need to construct the correct ID format since that’s not yet available for services). The join condition will make sure that only the services will remain in your data set.
The only thing that is still missing here is the alarm state. This is something that still needs to be added. Please create a new task for this if you’d also like to see this implemented.
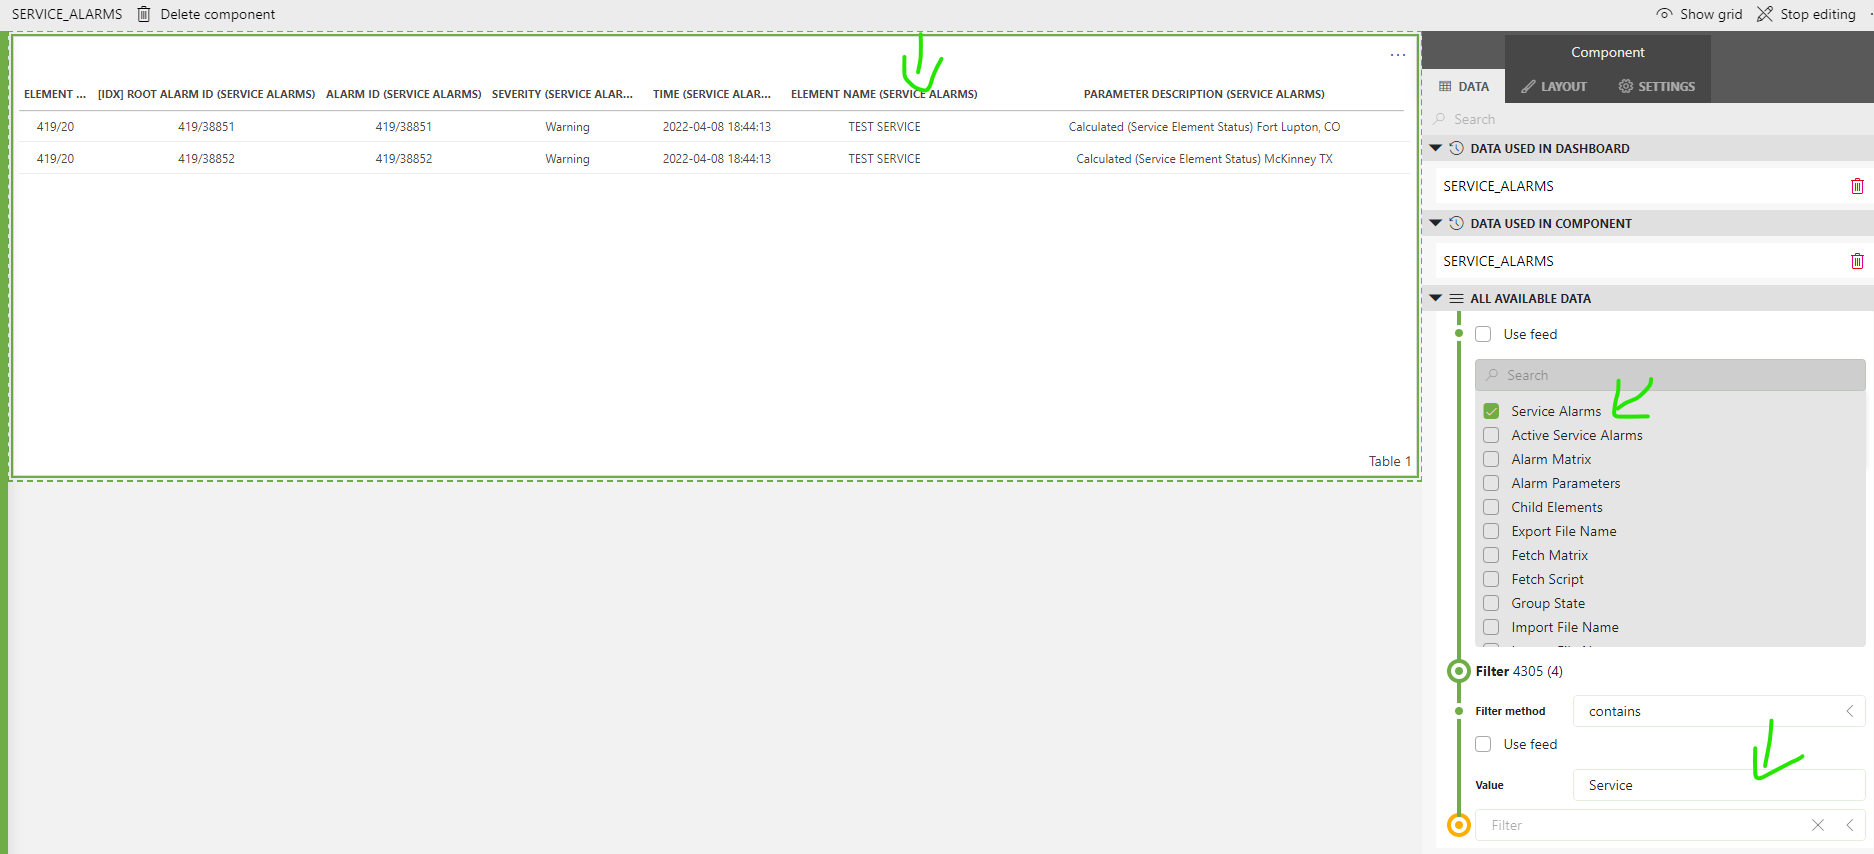
Sebastian – Things you could try:
- Use a service protocol on your services and have a parameter with the name of the service parent view
- Name your services in a way that you can identify them by certain filter (e.g., include the word service in in the name)
- Use GQI to bring in the Service Alarms and perform filtering by the key word and the view name once it is part of the service protocol
I hope it helps.
Hi Sebastian, I once created a quick dashboard with the standard components available, so just a matter of dragging and dropping. It will give you a dropdown of possible views. Upon selecting a view, it will show all services + a list of alarms, both filtered on the view. When selecting one or more services, the alarms are getting again filtered.
Not exactly what you were looking for, but maybe this is also an option.
Hi Jarno,
Thanks for the feedback and the explanatory GIF!
This is actually a good approach, however this will show ALL the alarms that belong to the services, including the alarms per child element.
I am looking for a higher level of alarm summary, where I see only the status of the services (I don’t care about the alarm element details).
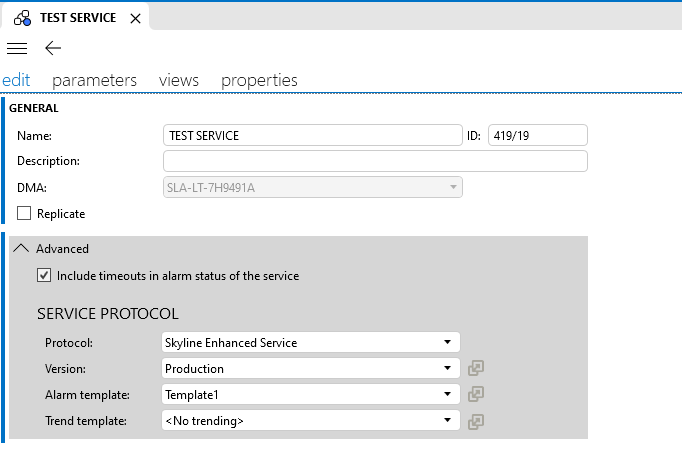
Hi Sebastian – I guess it depends then on the type of services you have in your system. The regular services do not have alarms, they only have an alarm state that they inherit from the included resources at that point of time. An Enhanced Service however can have it’s own set of metrics, which can be in an alarm state, and which could be filtered out. This is also what Rene points out in his response.
Thank for the explanation Ben. I’m currently using regular services so based of what you said, I needed the alarm inherited from the resources.
Thanks Miguel, that was exactly what I was looking for!