Hi,
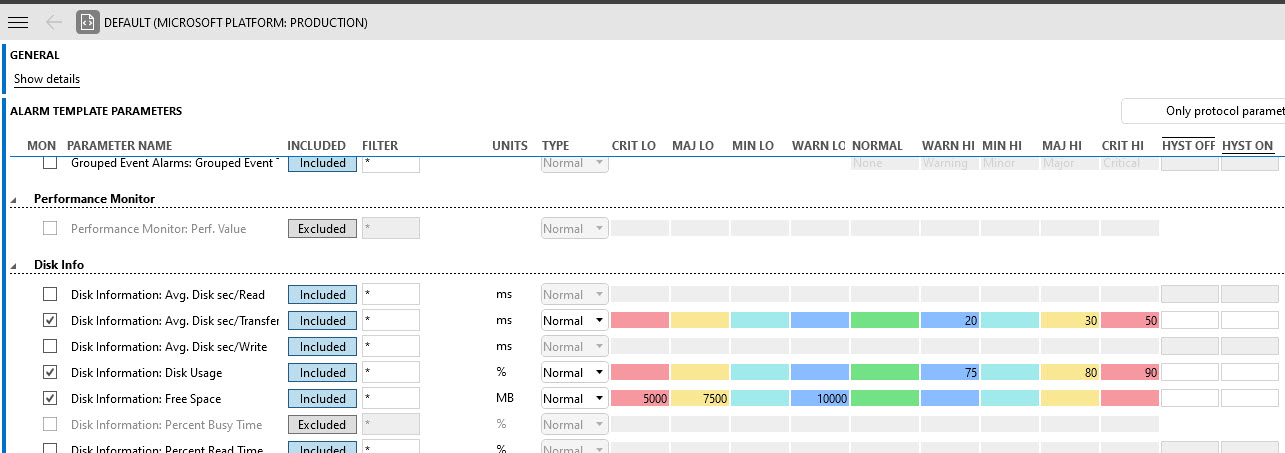
We use the Microsoft Platform to monitor several metrics of the Windows servers. Customers have asked what are the parameters that should be monitored in order to detect hard disk issues proactively and also the recommended thresholds.
Note 1: Keep in mind the screenshots below only show the parameter related to Disk. Other parameters might also need to be monitored but that is outside the scope of this questions.
Note 2: We used to monitor the Percent Busy Time but decided not to do that anymore since its value is linked to the RAID configuration and can vary greatly, going in some cases above 100% without that being indication of any problem.
After some internal discussion, we came up with the following template. I would like to know the thoughts of the community and if you recommend further tweaking.
Thanks in advance.


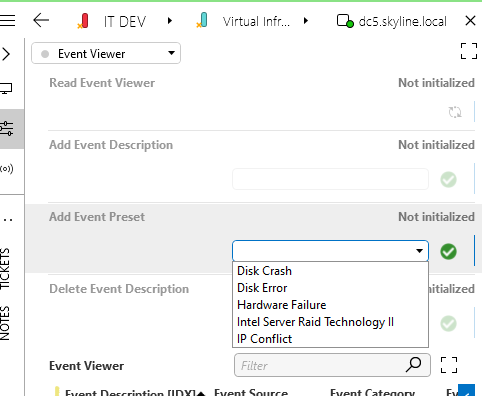
One thing I would add also is to use the Event Viewer message processing capability. This is not default enabled, and you have to do this in the driver itself. But it is useful to pick up events from the Event Viewer and to translate those to alarm messages in DataMiner. Related to storage, this can give you crucial information when disk errors (which typically indicate that a disk crash could be on the horizon) or crashes occur. These are available as pre-defined Events that you can filter out from the Event Viewer. Definitely recommended. 
Good tip. Thanks for sharing.
Hi Miguel,
the parameter “Avg. Disk sec/Transfer” has been proven very useful to detect problems with the disk to handle the throughput. And which can give big problems for a DataMiner system. So I also recommend to trend this parameter to catch certain peaks at certain moments.
Refer Health assessment guidelines for DataMiner Agents, you can put the thresholds even a bit more strict.
Thanks Karel
Keep in mind that on systems with very large Cassandra tables, you may need to reserve more free space for the compaction to be able to run, but as a general template I think this is good.
Thanks for your comments.
Some information online indicate Idle Time might also be a good metric to use however it is currently not included in the driver. Do you think adding that parameter to the driver would be a good idea / feasible?
% Idle Time
This counter provides a very precise measurement of how much time the disk remained in idle state, meaning all the requests from the operating system to the disk have been completed and there is zero pending requests.
This is how it’s calculated, the system timestamps an event when the disk goes idle, then timestamps another event when the disk receives a new request. At the end of the capture interval, we calculate the percentage of the time spent in idle. This counter ranges from 100 (meaning always Idle) to 0 (meaning always busy).