Hello,
I have used a stencil to create a KPI shape and tried to enhance it by adding a “Trend” icon next to it.
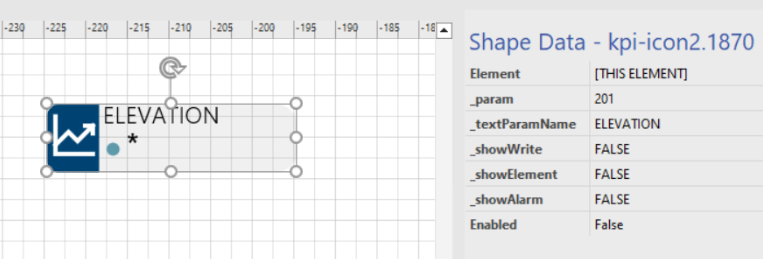
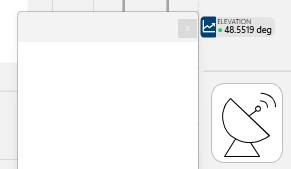
My goal is to display a trending graph for my Elevation data. The parameter ID is 201.
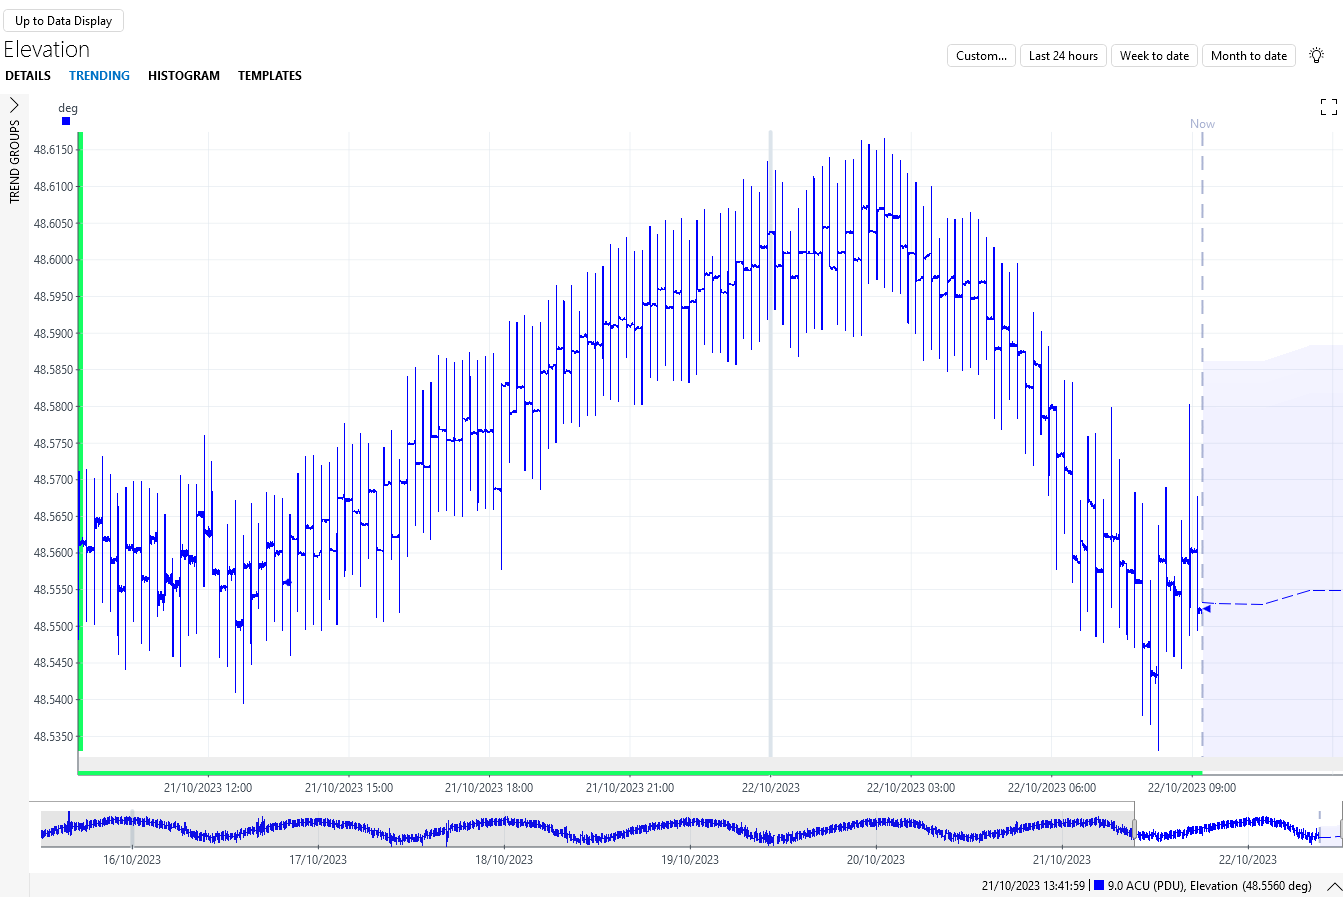
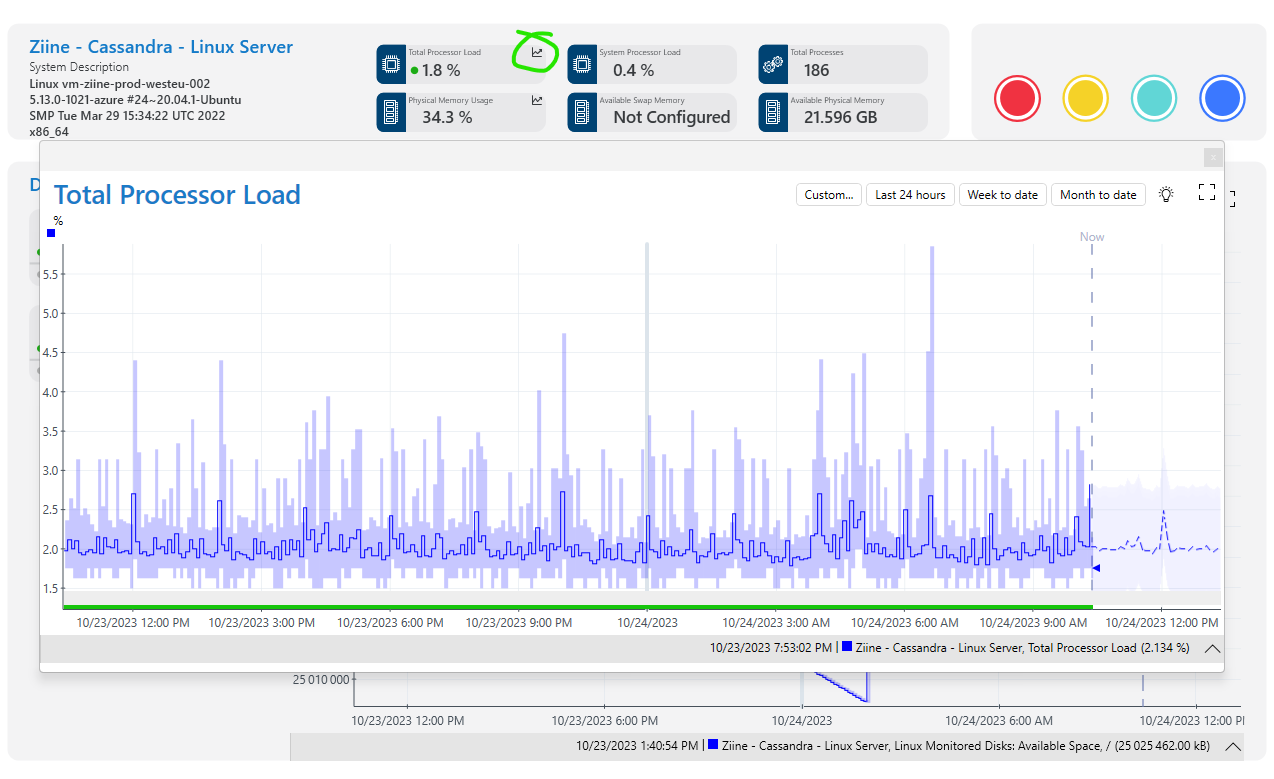
Below is the graph that I want it to be displayed when I click to the “Trend” icon.
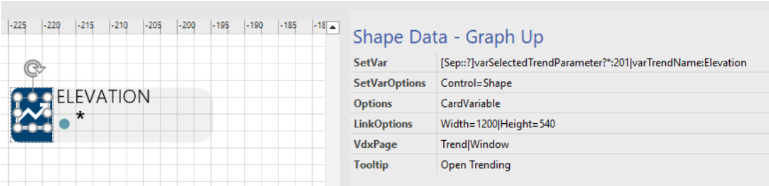
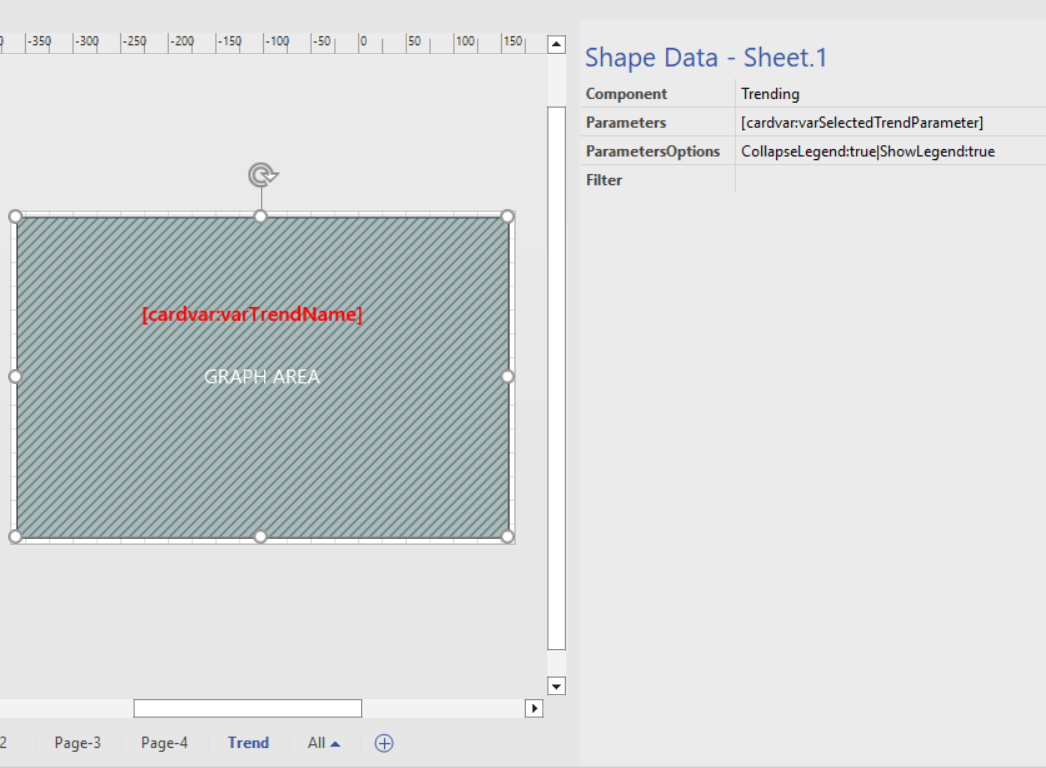
I’ve also defined a page named “Trend” and added a shape for my trend graph with the following shape data:
Unfortunately, the output I’m getting is just a blank window, as shown below:
I followed the same steps as the example I found in Ziine.
Appreciate any guidance or assistance with this issue.
Hi Nuril, along with what Toon suggested above, can you also verify that the Trend Icon shape you created is included as part of the Elevation group of shapes for the reading. If not part of the group, then the trend icon is not aware of what element linked to.
As this question has now been open for a long time and there has been no further reaction from you, we will now close it. If you do wish to investigate this further, feel free to post a new question or contact techsupport@skyline.be for assistance.
I see that this question has been inactive for some time. Have you found a solution for this yet? If yes, could you provide some information about this for reference for other users? If no, could you answer the questions Toon and Steve asked in the comments?
Hello Toon, Steve, and Marieke,
First of all, I’d like to apologize for the oversight in not replying to your helpful messages sooner. I truly appreciate the time you took to suggest isolating the issue and verifying the Trend Icon shape’s grouping.
I wanted to let you all know that I’ve found a solution by using SetVar and SetVarOption Shape Data Value. This approach helped ensure the correct session variable settings and resolved the issue with the Trend Graph as well.
Cheers!
Could you verify what happens when you click the button when it comes to your variables? The first thing I always recommend in situations like this is to isolate the issue. Is your session variable set not working, is it the sep placeholder that’s the issue, is it the popup combined with the setvar, is it the trendgraph itself… Trying to isolate what exactly is causing the issue will probably help in determining the problem and how to solve it.