Dear Dojo Community,
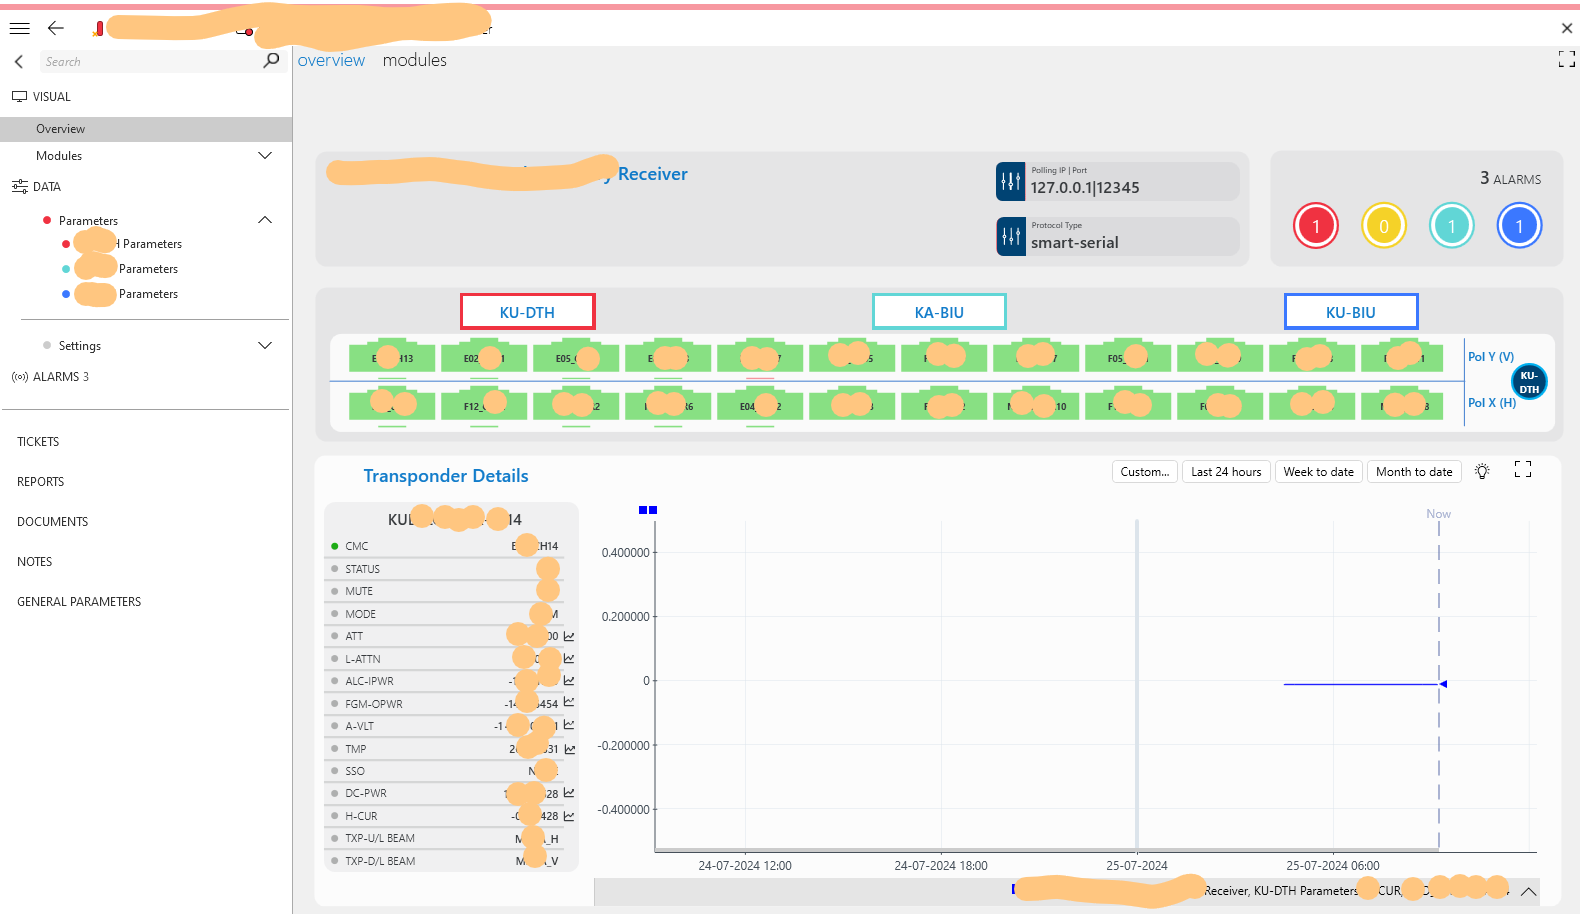
I developed two protocols. Protocol 1 has three modules and I created three table and three data sub page for each. I developed Visio for the same and I defined three Tab for Modules. On clicking on each Tab (KUDTH, KA-BIU, KU-BIU) loading table row and each row child click loading transponder details and trends. I'm able to maintain Tab alarm color in Visio using DataDisplayPage attribute and working fine. as mentioned below.
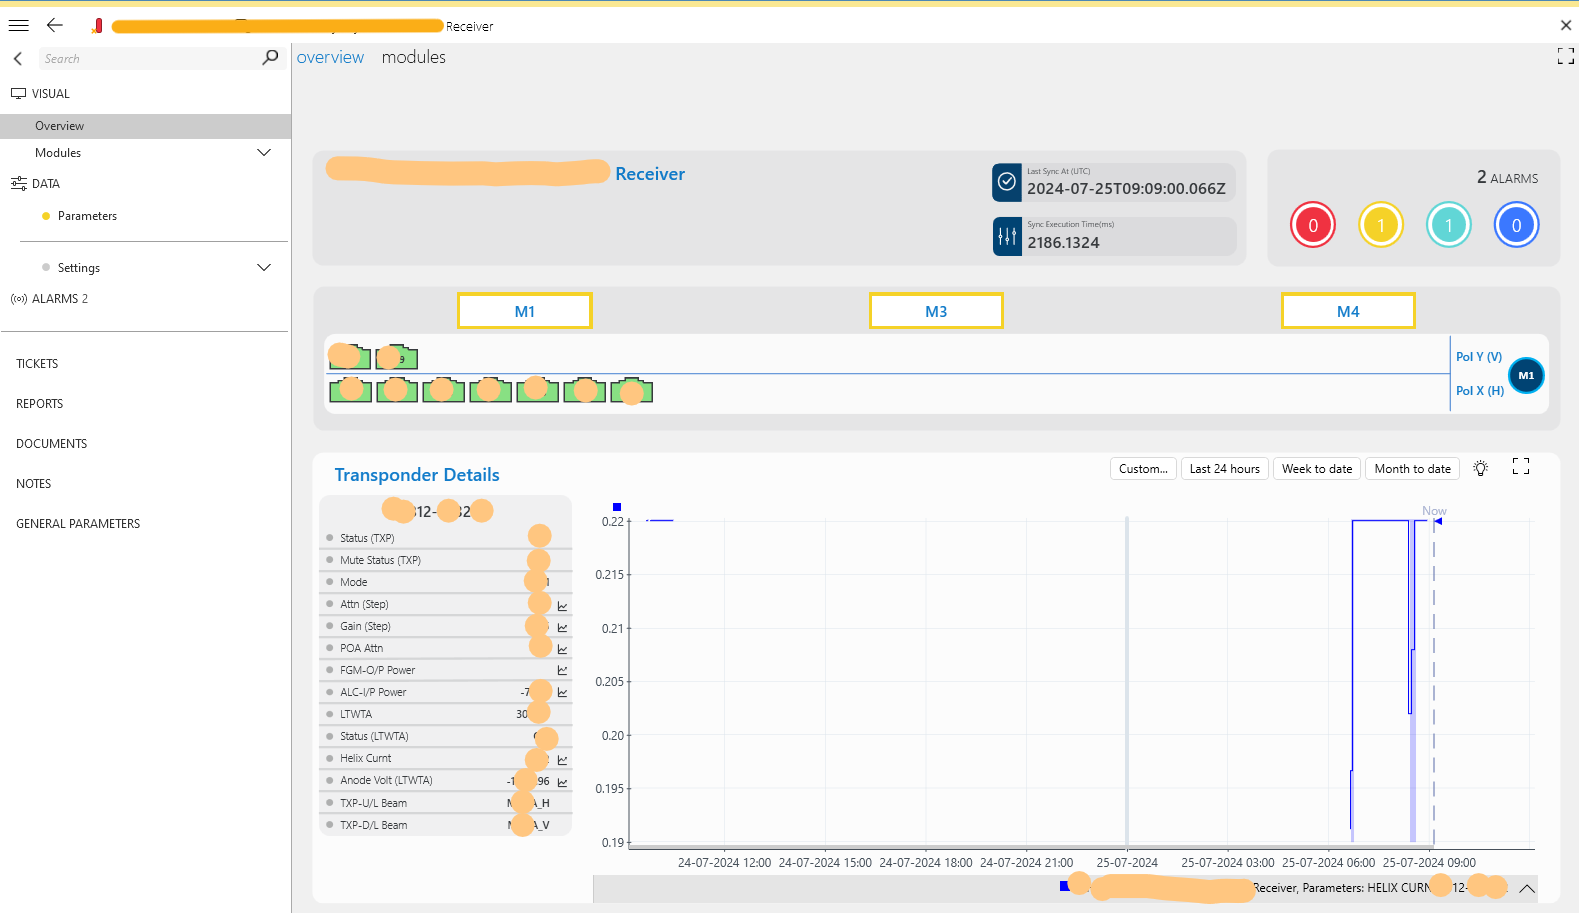
In second protocol, I created single data page and single table. This table contains all three module rows data and column "Module" has value M1, M3 and M4 to filter each row in table. I created the visio for the same. This visio also has three Tab(M1, M3 and M4),On clicking on each Tab loading table row and each row child click loading transponder details and trends. but I want to highlight Alarm color for each tab based on row alarm for each module. There could be multiple row for same module, need to use highest priority alarm color. I tried multiple way, but no luck. I don't want to make changes in protocol. Please help me how I can achieve this in Visio itself. As mentioned below
Yes I need to show Tab color based on multiple cells alarm (highest severity ). For example…
1. Table can have multiple rows for each module M1, M3 and M4 and for each row 4 cells are part of alarms. Need to highlight M1 Tab based on alarm state for 4 cells where Row module M1 and same for M3 & M4.
2. Out of 4 cells for M1, if two are in Major and 1 in Minor and 1 in Normal, then Major color should be Tab color
Hi Vikas,
I see that this question has been inactive for quite a long time. Do you still need help with this? If not, could you select the most relevant answer (using the ✔ icon) to indicate that no further reaction is needed?
As this question has now been inactive for a very long time, I will close it. If you still want more information about this, could you post a new question?
Hi,
We have a feature called "Parameterssummary" which can be added on a shape, it will allow you to have e.g. the "max" of a set of parameters shown: https://docs.dataminer.services/user-guide/Basic_Functionality/Visio/linking_shapes/Linking_a_shape_to_a_calculation_involving_multiple_parameters.html
Before I attempt answering this use case for a cool visio solution: Am I correct that the main problem you have is showing the highest severity alarm color from one or more table cells?