Dear Dojo Community,
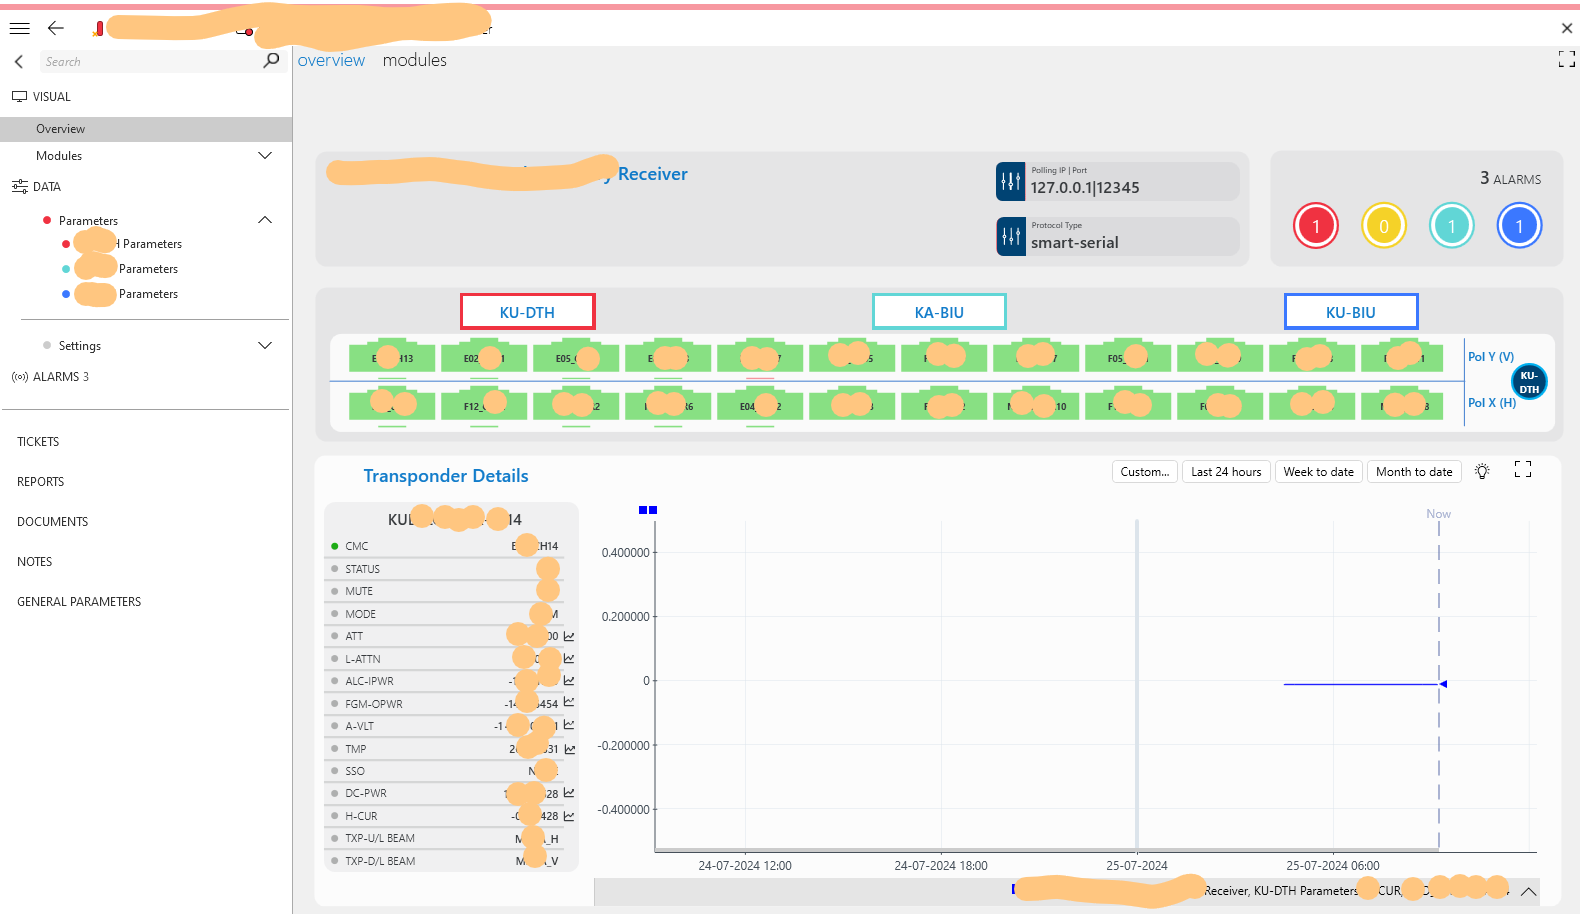
I developed two protocols. Protocol 1 has three modules and I created three table and three data sub page for each. I developed Visio for the same and I defined three Tab for Modules. On clicking on each Tab (KUDTH, KA-BIU, KU-BIU) loading table row and each row child click loading transponder details and trends. I’m able to maintain Tab alarm color in Visio using DataDisplayPage attribute and working fine. as mentioned below.

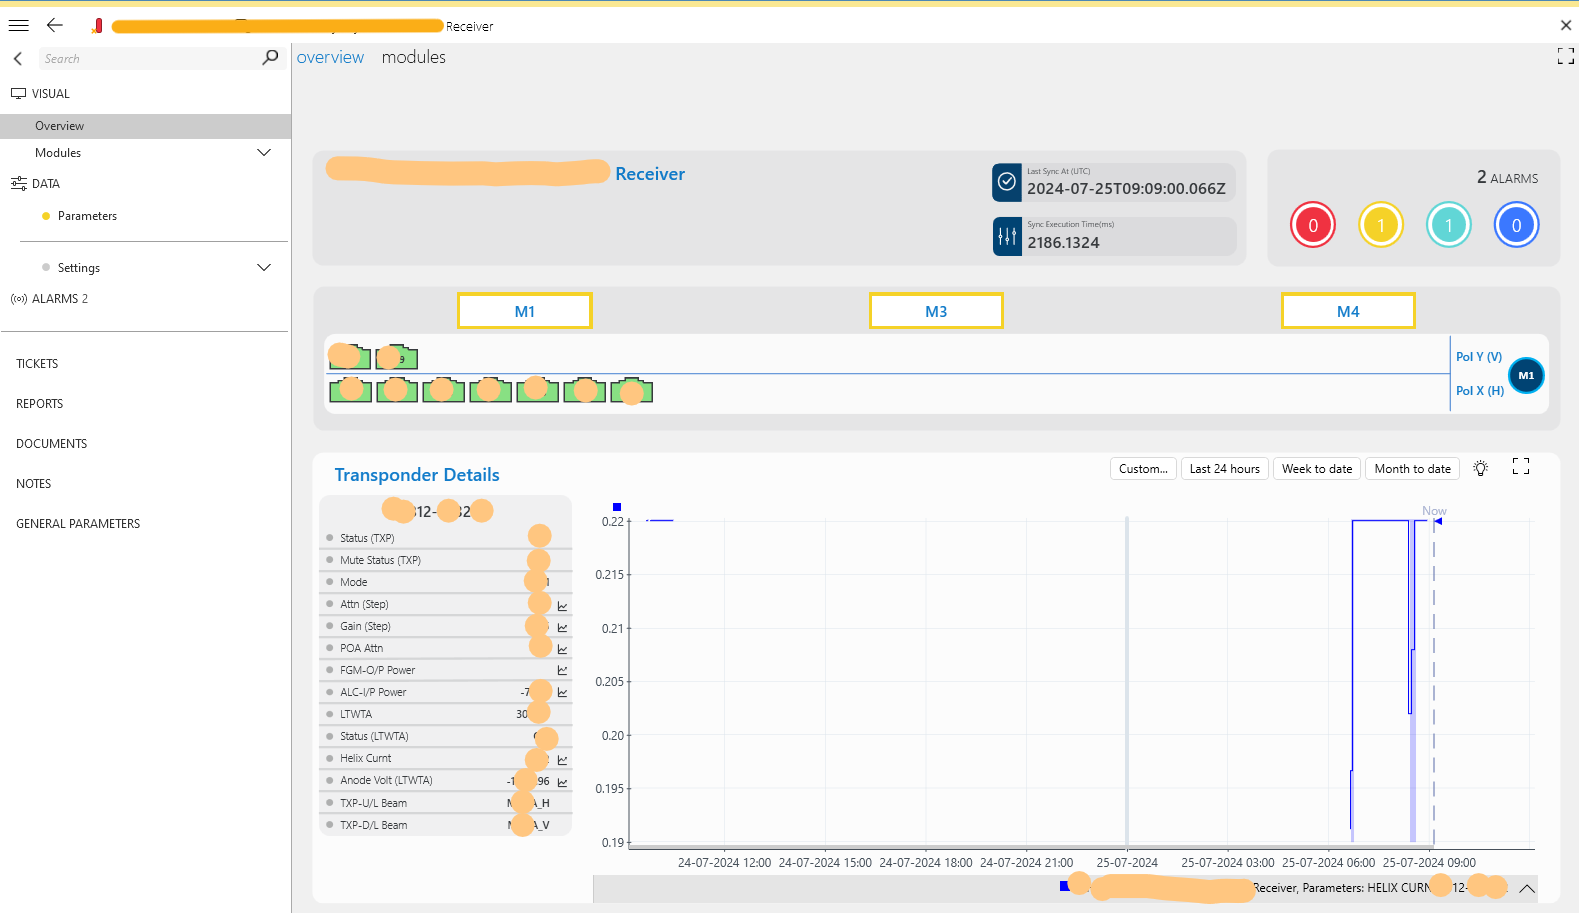
In second protocol, I created single data page and single table. This table contains all three module rows data and column “Module” has value M1, M3 and M4 to filter each row in table. I created the visio for the same. This visio also has three Tab(M1, M3 and M4),On clicking on each Tab loading table row and each row child click loading transponder details and trends. but I want to highlight Alarm color for each tab based on row alarm for each module. There could be multiple row for same module, need to use highest priority alarm color. I tried multiple way, but no luck. I don’t want to make changes in protocol. Please help me how I can achieve this in Visio itself. As mentioned below

Yes I need to show Tab color based on multiple cells alarm (highest severity ). For example…
1. Table can have multiple rows for each module M1, M3 and M4 and for each row 4 cells are part of alarms. Need to highlight M1 Tab based on alarm state for 4 cells where Row module M1 and same for M3 & M4.
2. Out of 4 cells for M1, if two are in Major and 1 in Minor and 1 in Normal, then Major color should be Tab color
Hi Vikas,
I see that this question has been inactive for quite a long time. Do you still need help with this? If not, could you select the most relevant answer (using the ✔ icon) to indicate that no further reaction is needed?
As this question has now been inactive for a very long time, I will close it. If you still want more information about this, could you post a new question?
Dear Klaas Dewitte,
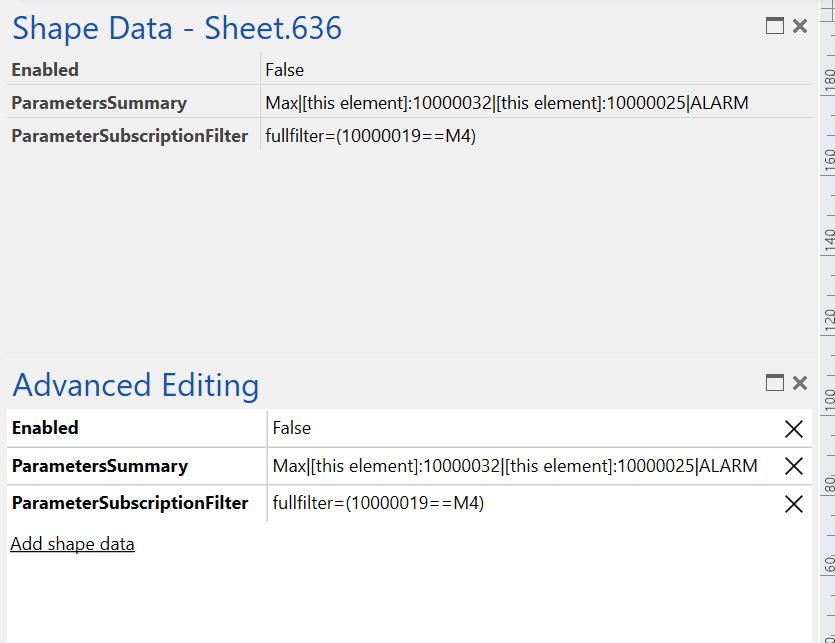
Thank you for sharing the details. It’s working fine if I’m passing specific row index like ([this element]:10000032:row1) for M1, M3 or M4. but There could be multiple row against column M1, M3 and M4, so I removed the rowIndex like (Max|[this element]:10000032|[this element]:10000025|ALARM) and it’s showing MAX error irrespective to module column but I need module column row filter as well. I tried to pass SubscriptionFilter, ParameterSubscriptionFilter and TableRowFilter with ParameterSummary but It’s not filtering too. Even I tried ParameterControlOptions with ClientSideRowFilter:10000019:M4, No luck. Please help me how I can show Tab Shape color based on table filter rows on module column.
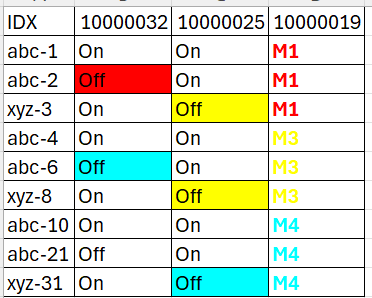
Example:- Like I mentioned sample table. This table contains 4 column, column 10000032, 10000025 are part of alarm. column 10000019 represent the module. So Module M1 Tab Shape color should be Red, M3 Tab Shape color should be Yellow and Module M4 Tab Shape should be Cyan.

Thank you

For work around, I passed some wildcard for IDX column, which is unique for module row. for example row index contains abc value for M1, xyz value for M3. it’s working fine but would be better if I can filter based on module column instead of row index.
Max|[this element]:10000032:*abc*|[this element]:10000025:*abc*|ALARM)
Max|[this element]:10000032:*xyz*|[this element]:10000025:*xyz*|ALARM)
Dear Dojo Community,
Please help how can I filter the rows along with ParameterSummry Alarm. I tired ParameterSubscriptionFilter but no luck.
Thanks
Hi
We currently do not support subscriptionfilters on parameterssummary, the only way to index is by using the index values.
A more dirty solution could be to create an automation script that runs on page open and creates variables in a certain format depending on the linked parameter. These variable can then be used as input to the parameterssummary. But as said, this would be decently dirty as a setup.
We also have a feature suggest sections: https://community.dataminer.services/feature-suggestions/
Dear Klaas Dewitte.
Thank you for your response.
It will be helpful to have this feature, do Skyline have any planned release for this. Please keep us posted.
Thank you
To update on this topic, currently there is no plan to implement this as part of Visio. It can however be added to the feature suggest section so we can grasp the interest of the community: https://community.dataminer.services/feature-suggestions/
Hi,
We have a feature called “Parameterssummary” which can be added on a shape, it will allow you to have e.g. the “max” of a set of parameters shown: https://docs.dataminer.services/user-guide/Basic_Functionality/Visio/linking_shapes/Linking_a_shape_to_a_calculation_involving_multiple_parameters.html
Before I attempt answering this use case for a cool visio solution: Am I correct that the main problem you have is showing the highest severity alarm color from one or more table cells?