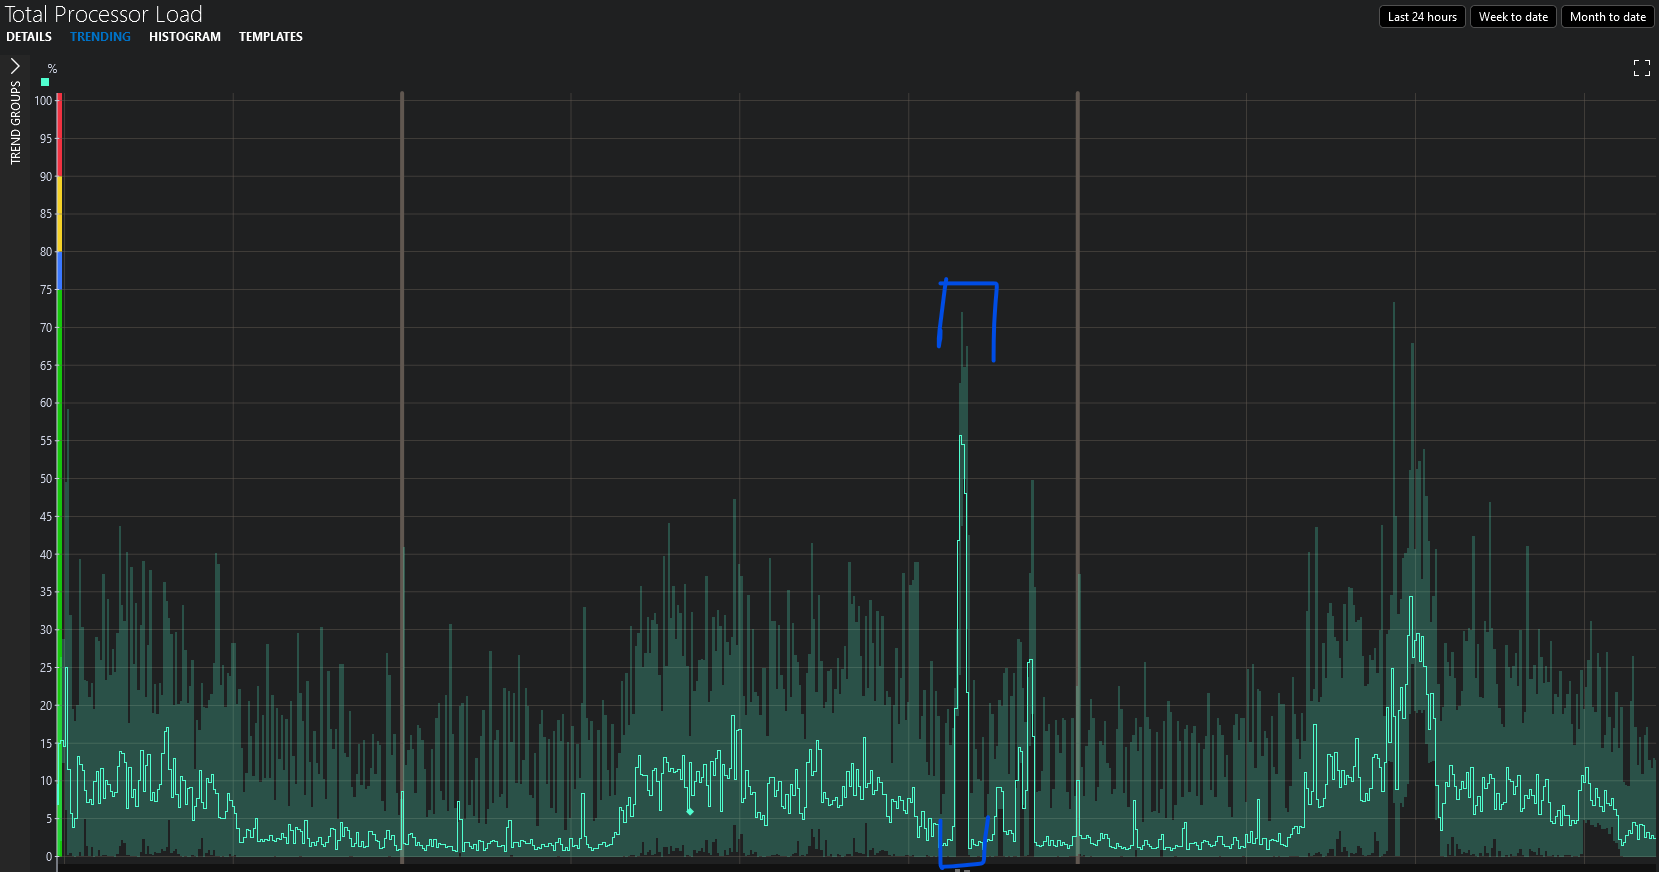
Hi Dojo
A couple of days ago we had an unusual spike in CPU load on an SQL server.
Fortunately for us, we had a DataMiner monitoring that system.

Is there a way for me to go back through the history of the task manager to figure out what caused the sudden spike in CPU?
Driver is the “Microsoft Platform” version 1.1.3.7.
https://catalog.dataminer.services/result/driver/251
Thank you in advance for your help.
Kind regards
Hi Ben,
I guess you will need to enable “Poll Task Manager” and add trending to the “CPU” parameter.
This way you will be able to check trending of the different processes to pinpoint further what process suddenly took more CPU.
Regards,
You could also leverage the power of GQI in a dashboard.
Release Notes – GQI – Retrieve history data for parameter… (skyline.be)
Release Notes – GQI – Be able to filter on history data (skyline.be)
Reinout also has posted an blog about how to analyze trend data using GQI:
How to analyze historical trend data with the GQI – DataMiner Dojo
Hi Ben,
If you have alarming enabled on the “CPU” parameter, you can request the alarms of that specific timespan and filtered for this protocol in the alarmconsole.
These alarms can show you what process took more CPU at that time.