Skip to content
DataMiner DoJo

More results...

Generic selectors
Exact matches only
Search in title
Search in content
Post Type Selectors
Search in posts
Search in pages
Search in posts
Search in pages
Log in
Menu
  • Updates & Insights
  • Questions
  • Learning
    • E-learning Courses
    • Empower Replay: Limited Edition
    • Tutorials
    • Open Classroom Training
    • Kanban workshop
    • Certification
      • DataMiner Fundamentals
      • DataMiner Configurator
      • DataMiner Automation
      • Scripts & Connectors Developer: HTTP Basics
      • Scripts & Connectors Developer: SNMP Basics
      • Visual Overview – Level 1
      • Verify a certificate
    • Video Library
    • Books We Like
    • >> Go to DataMiner Docs
  • Expert Center
    • Solutions & Use Cases
      • Solutions
      • Use Case Library
    • Markets & Industries
      • Media production
      • Government & defense
      • Content distribution
      • Service providers
      • Partners
      • OSS/BSS
    • Agile
      • Agile Webspace
      • Everything Agile
        • The Agile Manifesto
        • Best Practices
        • Retro Recipes
      • Methodologies
        • The Scrum Framework
        • Kanban
        • Extreme Programming
      • Roles
        • The Product Owner
        • The Agile Coach
        • The Quality & UX Coach (QX)
    • DataMiner DevOps Professional Program
      • About the DevOps Program
      • DataMiner DevOps Support
  • Downloads
  • More
    • DataMiner Releases & Updates
    • Feature Suggestions
    • Climb the leaderboard!
    • Swag Shop
    • Contact
    • Global Feedback Survey
  • Support
  • PARTNERS
    • All Partners
    • Technology Partners
    • Strategic Partner Program
    • Deal Registration
  • >> Go to dataminer.services

How to execute classical reports query in the new dashboard module

Solved1.68K views18th July 2023Dashboards Reporter
1
Laurens Moutton [SLC] [DevOps Enabler]8.89K 11th June 2021 0 Comments

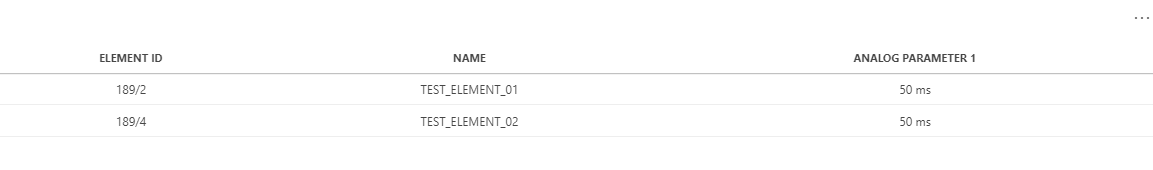
With the classical Reports & Dashboards module, it was possible to execute a simple query and to see a table that would give an overview of the selected parameter(s) in one table:

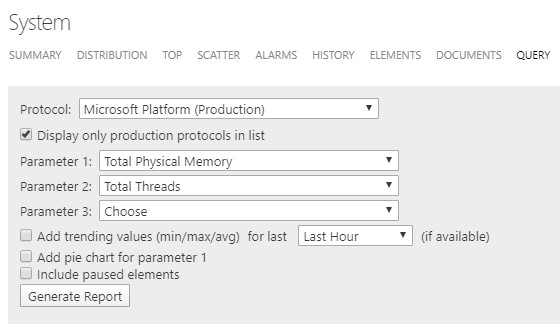
I’m trying to do the same thing with the new dashboards module. The closest I could get is to use the “Query” data and specify the items like shown in the screenshot:

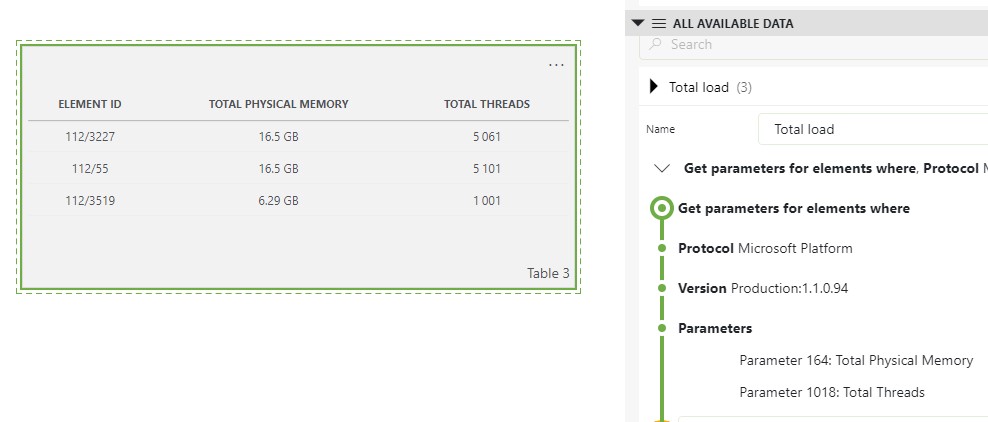
Type “Table 3” shows the element id instead of the element name, other types like “State 3” shows a GUID.

-How can the element name be shown in the table? I tried to add “column manipulations” but that doesn’t seem to show how to get to display the element name

-The classic report module had the option to select to add trending values (min/max/avg), is that also possible with the new dashboard data query? Or am I using the wrong component and is there an alternative available to easily have the same query functionality like the classic reporter has?

Marieke Goethals [SLC] [DevOps Catalyst] Selected answer as best 18th July 2023

3 Answers

  • Active
  • Voted
  • Newest
  • Oldest
2
Rene De Posada [SLC] [DevOps Advocate]1.90K Posted 11th June 2021 0 Comments

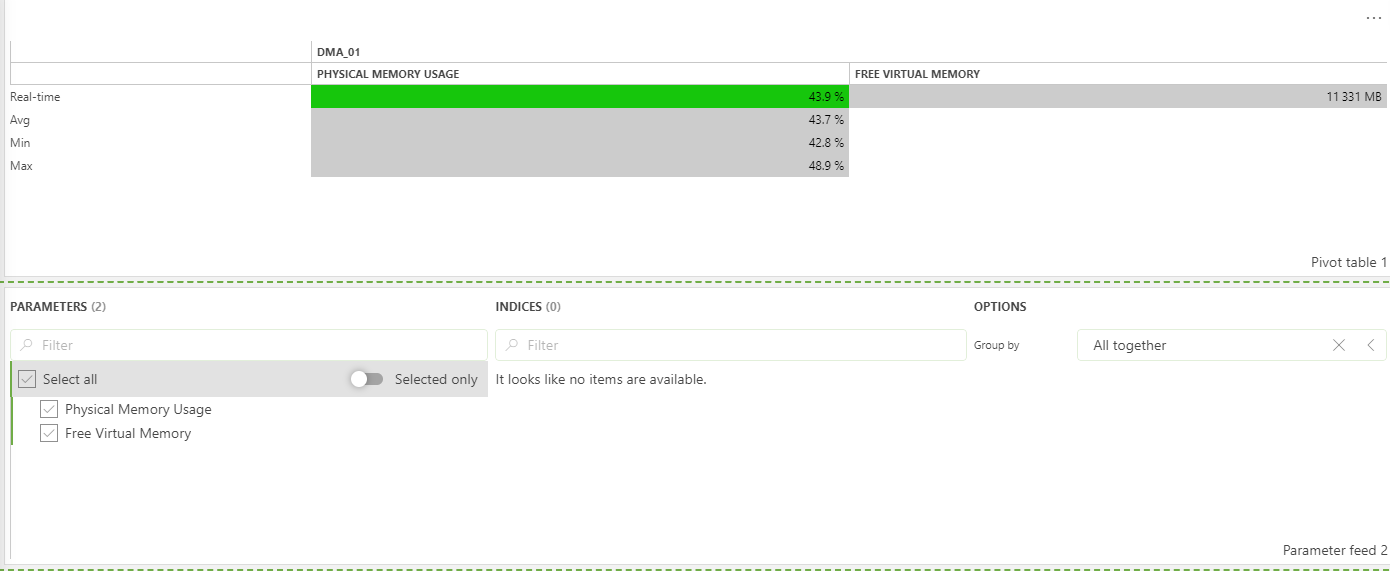
For this use case, the Pivot table would be more than enough. You can use the parameter feed and pass the parameters you need to the table.

You could, also, add avg, min, and max to the results. Showing the source element is also possible following this approach.

If needed, the time range component could be used to further filtering.

For trending, the line and area chart could be used and the same parameter and time period feeds may be used.

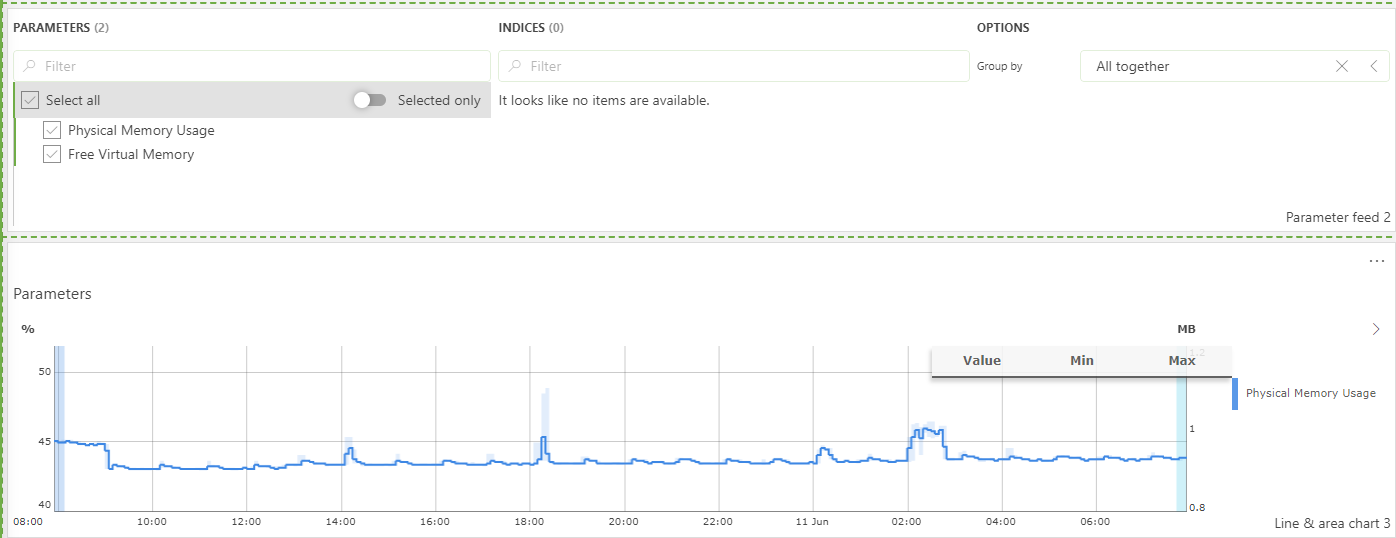
Note that most of the options above are also possible via GQI.

Marieke Goethals [SLC] [DevOps Catalyst] Selected answer as best 18th July 2023
2
Miguel Obregon [SLC] [DevOps Catalyst]19.21K Posted 11th June 2021 0 Comments

Hi Laurens,

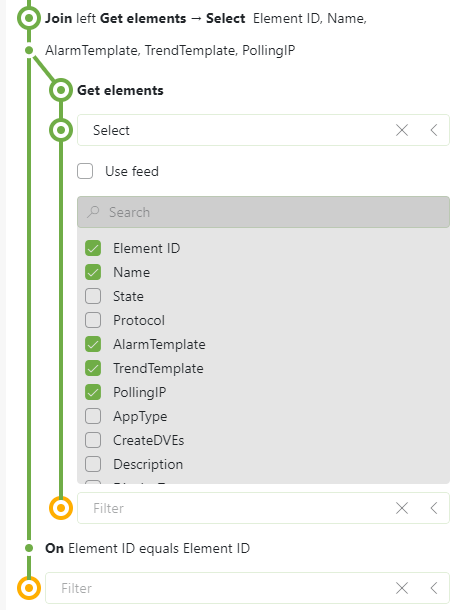
For the first question, you can extend your query using an inner join with ‘Get Elements’. The join should be done based on Element ID:

  • Add the following entry to your query: Join (Type Inner)
  • In the next entry ‘Filter’ select ‘Get Elements’
  • In the next entry choose ‘Select’. For your use case, you only need to select the columns ‘Element ID’ and ‘Name’
  • In the Join entry, select as filter (in both fields) ‘Element ID’. You will see the Element ID and name displayed in the table.
  • (Optional) in the next entry, choose ‘Select’. This will allow you to choose which columns are displayed in the table. Keep in mind that you can also manipulate the order to the columns

For the second question, there is a feature available from 10.1.4 to retrieve historic data (including min, max and average values) from queries. However this feature is only available for table parameters. Additional information can be found in RN29121

Miguel Obregon [SLC] [DevOps Catalyst] Answered question 11th June 2021
1
Jens Vandewalle [SLC] [DevOps Enabler]9.50K Posted 11th June 2021 0 Comments

Hi Laurens, you can achieve this by extending your query as shown below.

As far as I know it’s not possible to show trend information in the table.

Jens Vandewalle [SLC] [DevOps Enabler] Edited answer 11th June 2021
Please login to be able to comment or post an answer.

My DevOps rank

DevOps Members get more insights on their profile page.

My user earnings

0 Dojo credits

Spend your credits in our swag shop.

0 Reputation points

Boost your reputation, climb the leaderboard.

Promo banner DataMiner DevOps Professiona Program
DataMiner Integration Studio (DIS)
Empower Katas
Privacy Policy • Terms & Conditions • Contact

© 2025 Skyline Communications. All rights reserved.

DOJO Q&A widget

Can't find what you need?

? Explore the Q&A DataMiner Docs