I am helping a customer build a dashboard that displays trend data.
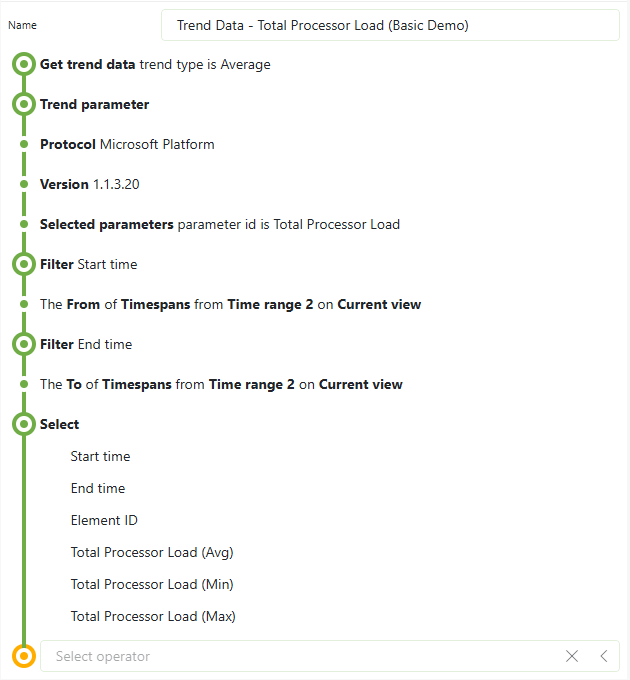
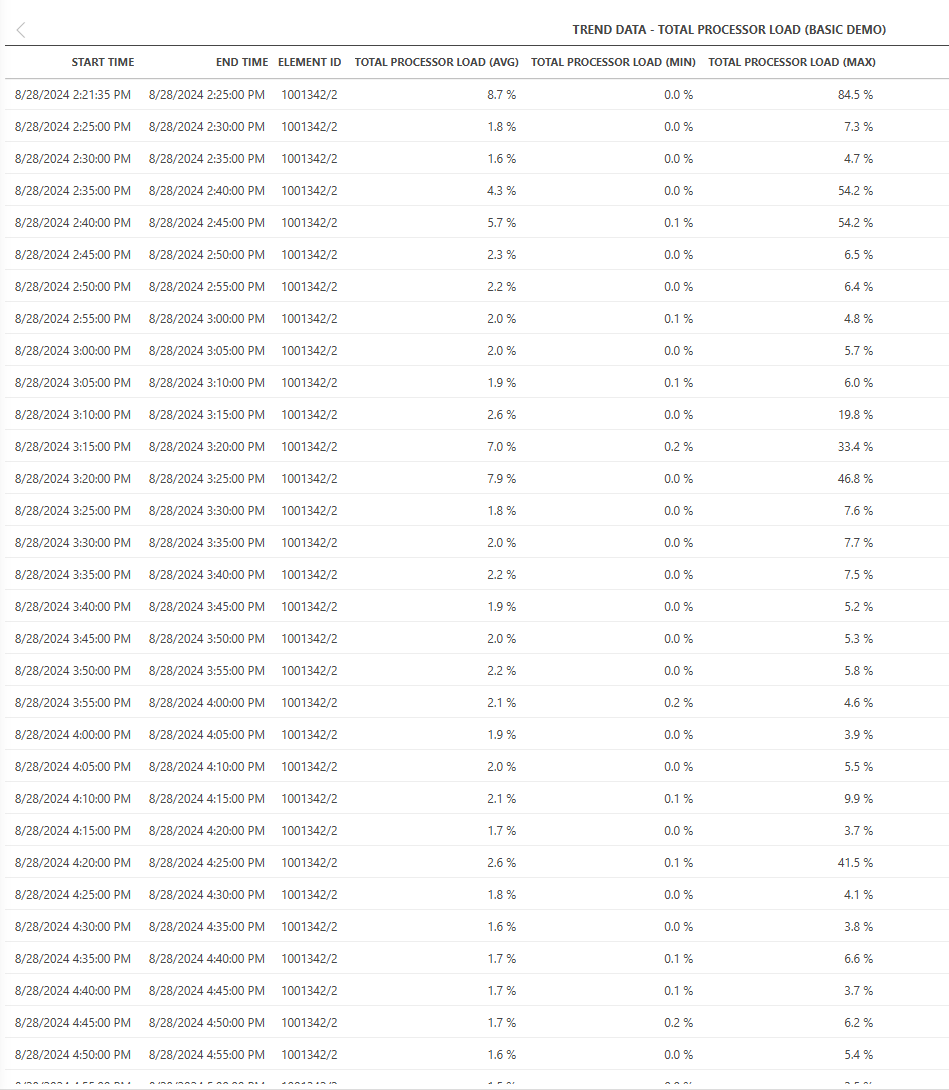
In my test environment, running 10.4.10 (CU0), I can use Get trend data to display the information as follows:


According to this information GQI Get trrend data and Dataminer release – DataMiner Dojo, the customer will need to enable ‘GenericInterface’ soft-launch flag to access the Get trend data source in the 10.4.0 Main Release.
That should be fine. However, since this information is more than 1 year old and there is still no documentation under Query data sources | DataMiner Docs, I would like to know if anything has changed in the latest releases.
How to display 60-min trend average?
In my tests, I noticed the Get trend data does not explicitly differentiate between 5-min and 60-min trend average data rather seems to display everything together. After 1 month, the 5-min average appears to be deleted and only the 60-min average remains.
In our case, we don’t care about the 5-min average, we only want to see the 60-min average.
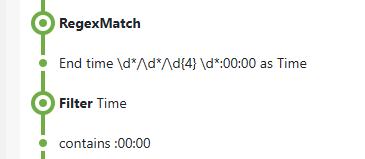
I can filter out the unwanted entries by first adding a regex column as follows:

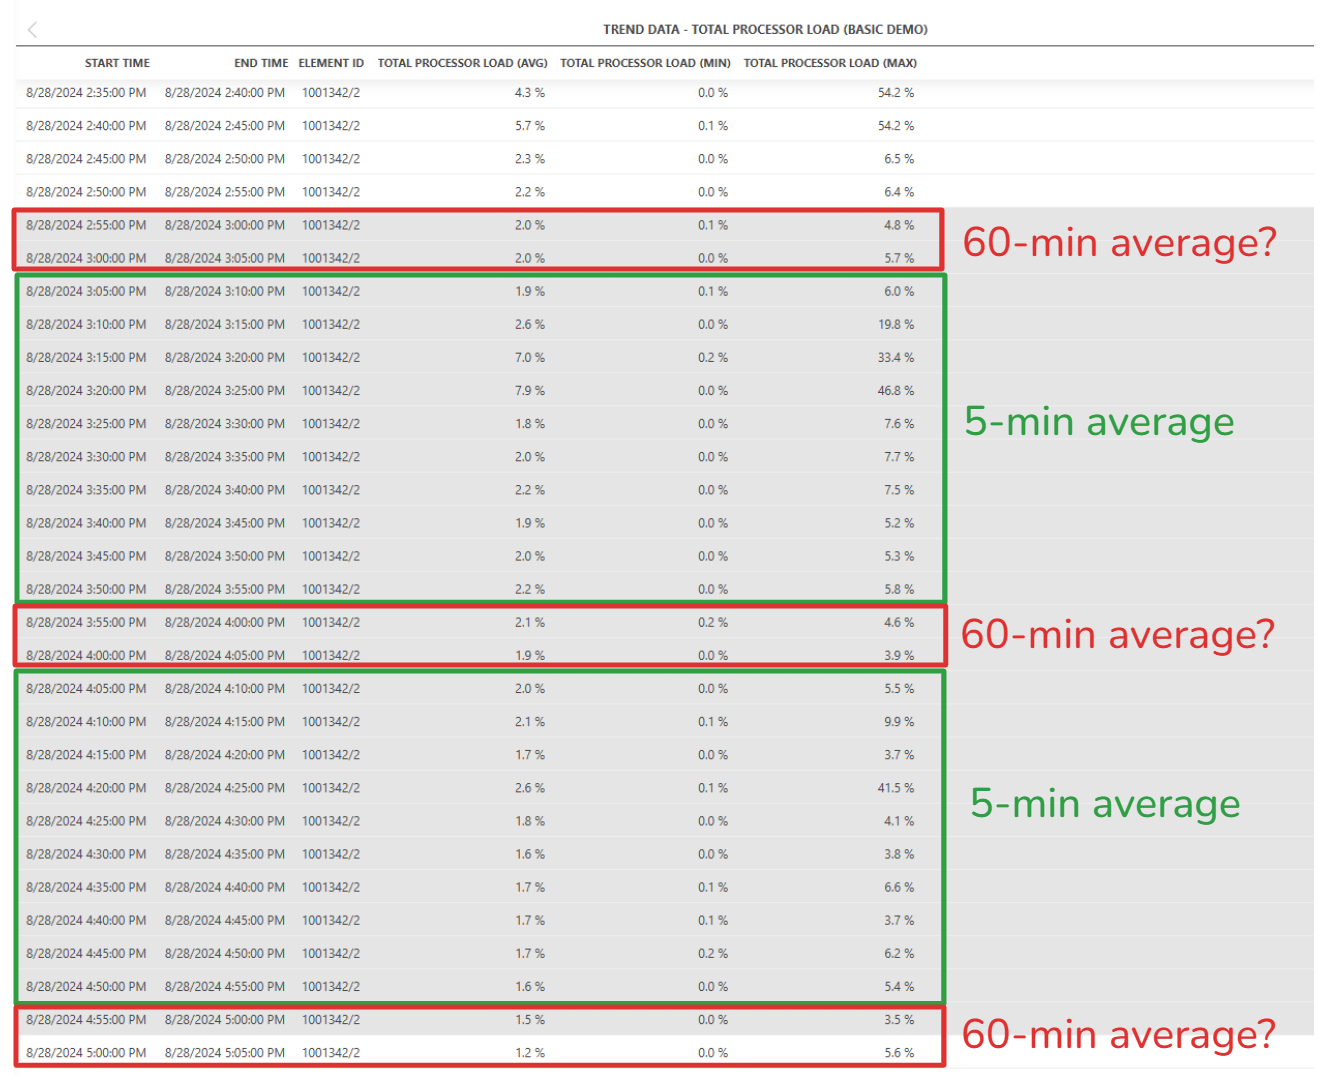
However, it doesn’t look like the entries at the top of the hour truly represent the 60-min average. If they were, the MAX value should correspond to the MAX value of the last hours, but this is not the case.
I am concerned that the entries at the top of the hour are just the average, min, and max of the last 5-min time window.
I know DataMiner used to calculate 5-min and 60-min averages and store all those entries in the database. As time passed, the 5-min averages would get deleted and only the 60-min average would remain. I assume that is still the case in newer versions of DataMiner, but I would like someone to confirm.
How can I retrieve the entries with the average, min, max of the last 60 minutes before a month has past? Those values should be stored in the database.

Thank you very much for your help.
Hi Miguel,
There have not been any functional changes to the GQI Trend data source over the past year, so all information that exists is still relevant.
As you correctly suspected, the entries at the top of the hour only show the aggregated values of the last 5 minute interval.
In fact, the values always apply to the interval specified by the Start time and End time columns.
According to the documentation, the behavior of DataMiner regarding average trend values is still similar. Averages further in the past will be stored over larger intervals.
See: https://docs.dataminer.services/user-guide/Basic_Functionality/Trending/Trending_techniques.html#average-trending
However, it would be a mistake to assume that the query rows will always return fixed intervals in that exact pattern.
If you want to retrieve aggregated trend values over a fixed custom interval, this can be achieved using an Ad Hoc data source.
This will allow you to fetch the raw average trend points and then calculate a weighted average of the values based on the time interval.
There already exist an Ad Hoc data source on GitHub working with trend data that you could use as a starting point: SkylineCommunications/SLC-GQIDS-TrendDelta: A GQI data source for differences between trend points over a specified interval. (github.com)
Most likely other private projects also exist that have implemented something similar.