Hi all,
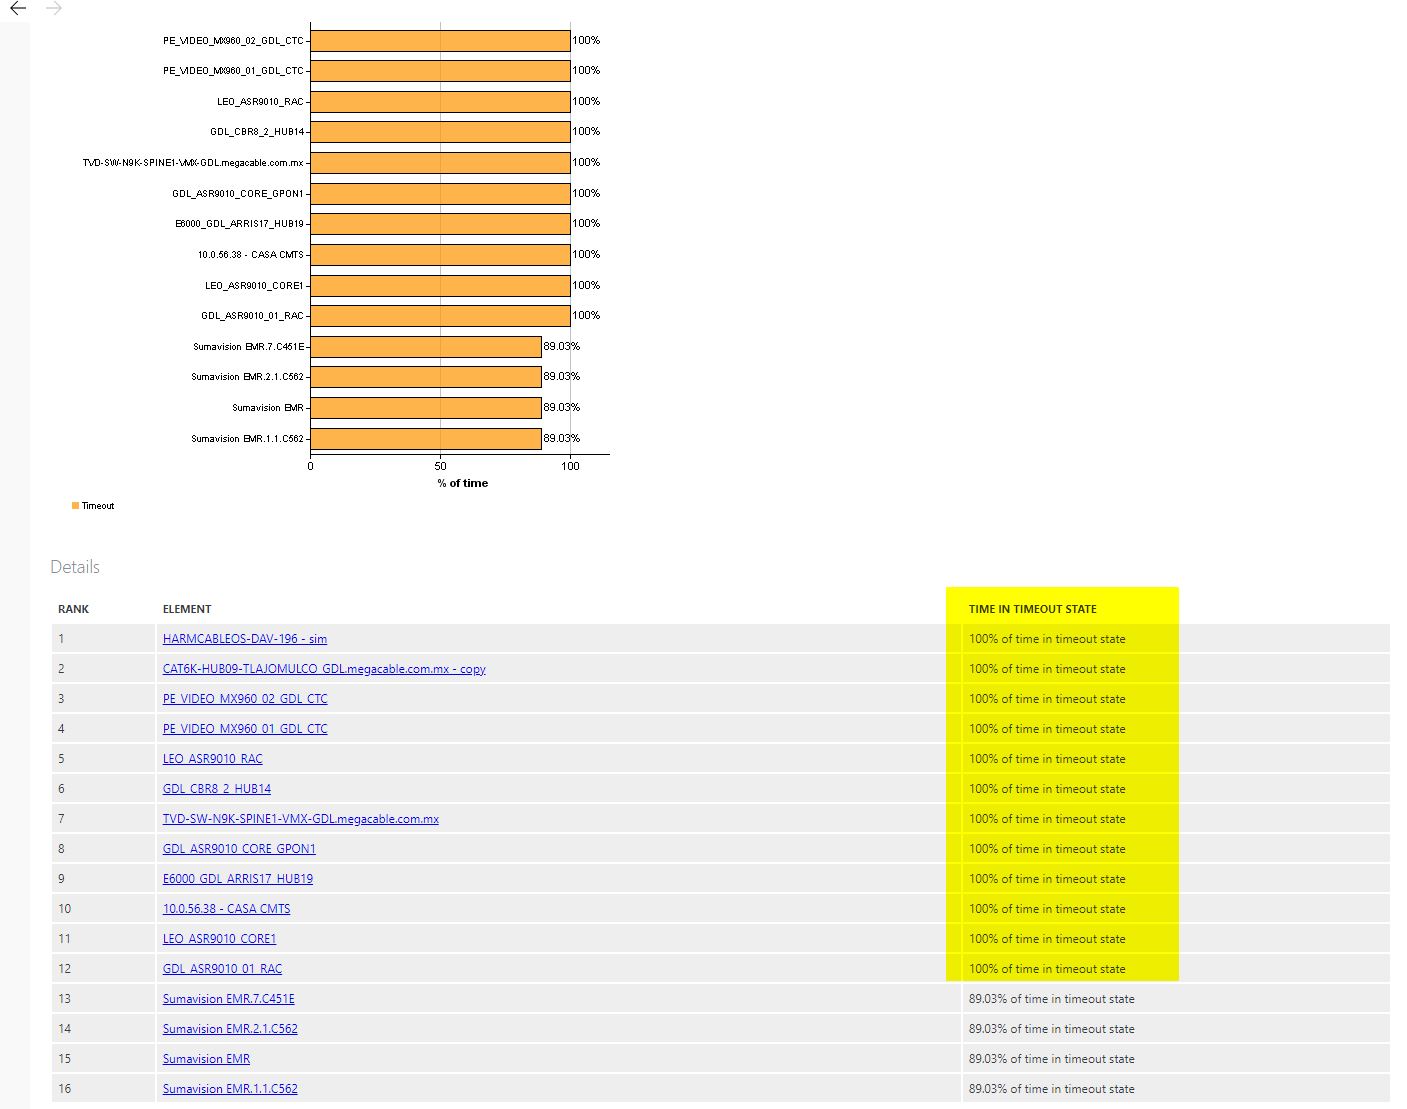
In the legacy reports we have an option to get the percentage amount of time in a specific alarm state for elements using the “Top 10 states/New alarm count” building block.

How this could be possible to retrieve with a query in our new dashboards so we can manipulate or export the information as csv?
Hi Edson,
I guess you’ll have to use a custom operator for this. In that operator you can
- subtract the alarm root time from the current time
- calculate the percentage based on your time window
Do note that this comes increasingly more complex for elements, services and views. Ideally we also support this natively in our new dashboards application.
Edson,
From 10.3.4 onwards, GQI adhoc data sources will support a secured link towards DataMiner Core (SLNet) so that you can send any message that Cube or any other client would sent (RN35701). This way you can for example sent messages to retrieve state timelines and easily convert that into the data you want to provide to your dashboard.
Hope this helps, please let me know if you need more details.
PS: we’re working on a catalog where we can put adhoc source like this in, so they can be made available to all of you in a convenient way. Stay tuned on the upcoming 10.3 feature releases of DataMiner!
Fyi this component is also available in the new Dashboards app by dragging a view on a “column & bar chart” visualization. But that doesn’t let you manipulate/export the data, you’ll indeed need a GQI query for this.