Tired of time-consuming investigations? DataMiner 10.3.8 is here to provide you with insights based on learned relations between parameters within particular timeframes. This new release is sure to enhance your data analysis experience and decrease time required for investigating issues.
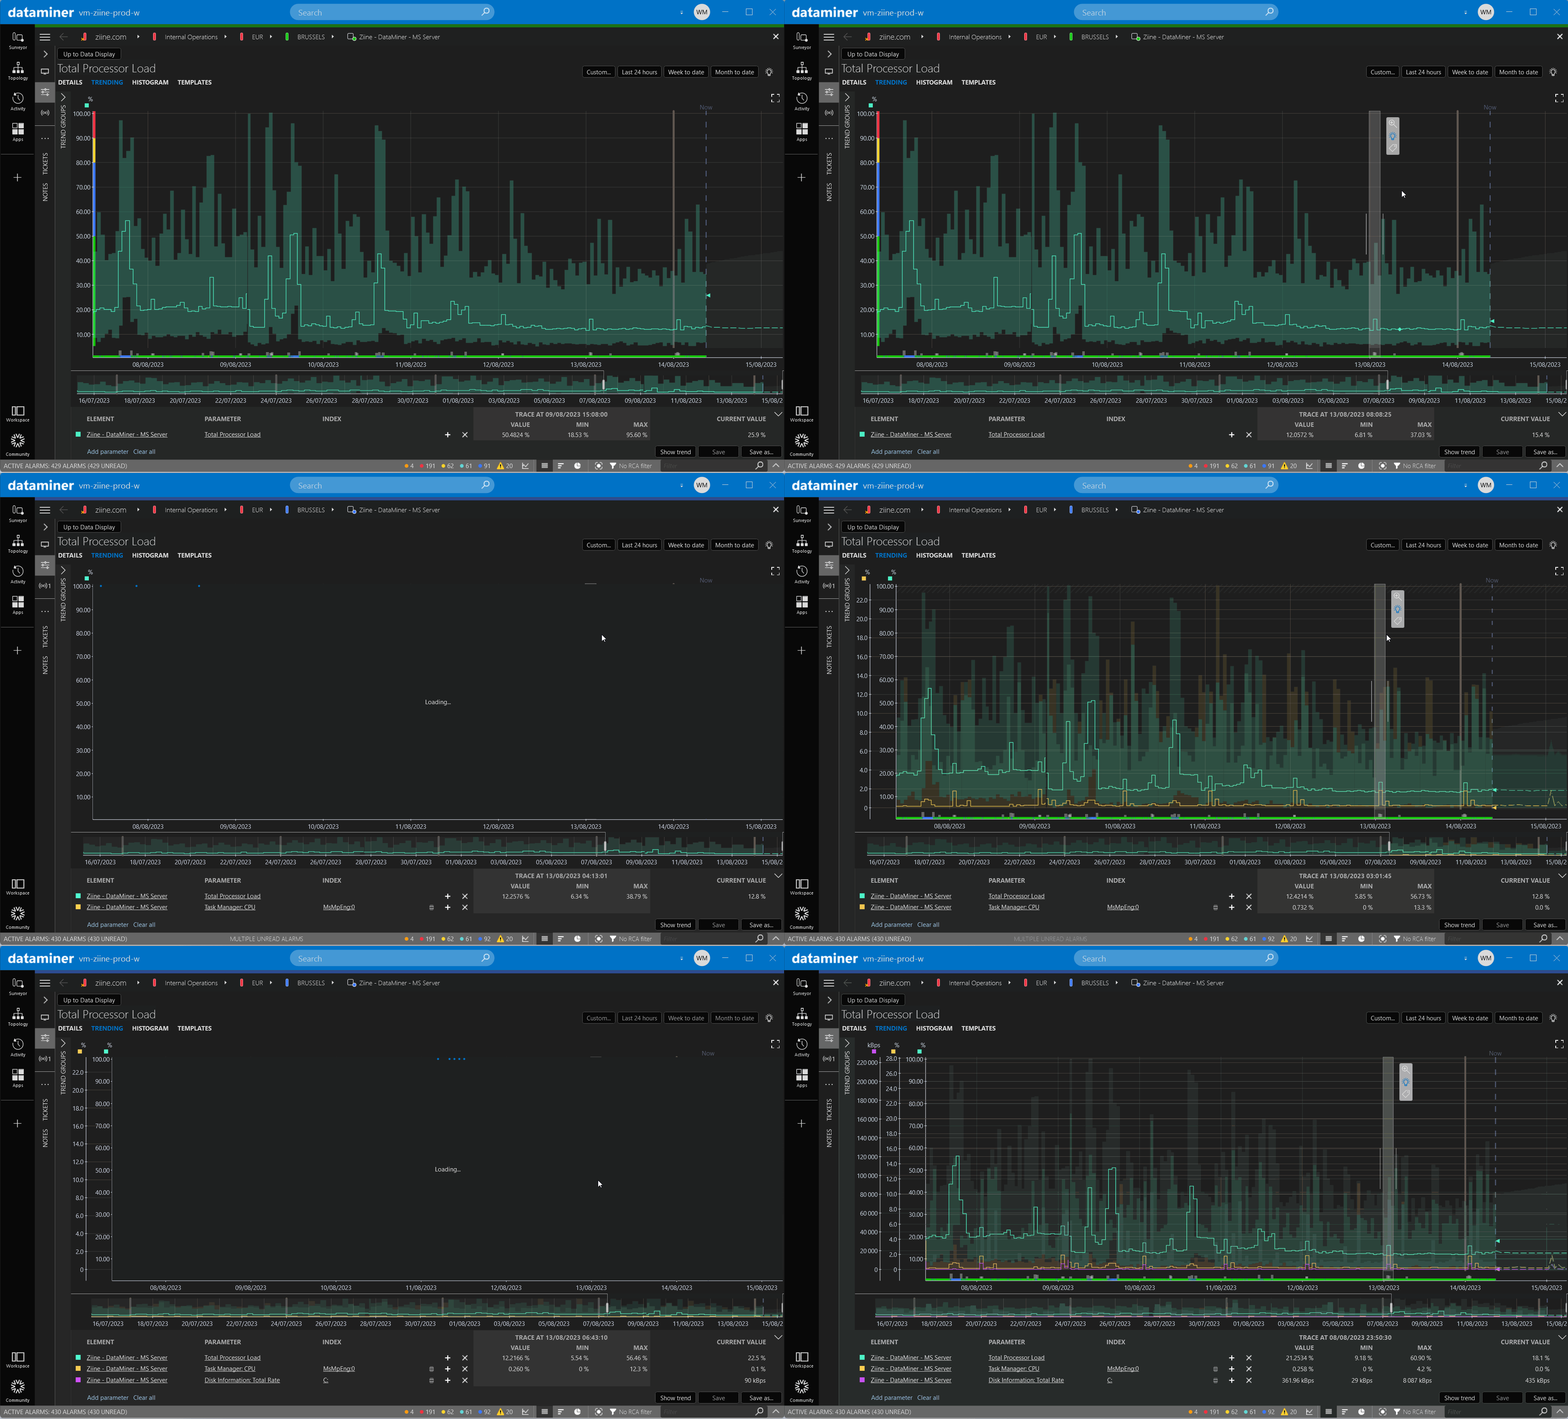
The example below showcases how DataMiner provides those insights. In this case, we are curious about the cause of the periodic spikes in the total processor load. Instead of analyzing every trend graph of the CPU of each process in the Task Manager, we can simply select the section of the graph where the spike occurs. By doing so, we can immediately see interesting suggestions such as “Task Manager: CPU MsMpEng:0” and “Disk Information: Total Rate C:”.

Clicking these suggestions promptly loads the trend graphs of the corresponding parameters, allowing us to visually confirm our findings. With just one click, we successfully identify the specific process responsible for the spikes.
Further Google research reveals that ‘MsMpEng’ is an abbreviation of ‘Microsoft Malware Protection Engine’, which is the built-in antivirus program. This discovery immediately also explains the spike in the disk rate. Go to our Ziine Demo System to experience this firsthand!
Read all about adding time-scoped related parameters to a trend graph in the DataMiner Docs.
Don’t have access to Ziine yet?
Ziine is our live demo system, which lets you explore the power of DataMiner for free! Get a taste of DataMiner and see for yourself why it’s the leading NMS/OSS solution for the ICT media and broadband industry.
I have used it a couple of times already and must say it work pretty well. Typically I’m clicking the little gray rectangle at the bottom of the trend line (indicating a change in trend behavior), which gives me the selection of trend data in one go.
I’m looking forward to see more DataMiner Insights of that kind. Quick, handy and useful!
I really love this one! It saves me a lot of time when I need to investigate CPU spikes, memory leaks etc.