In our relentless pursuit of enhancing your experience with the DataMiner Low-Code-Apps and Dashboards, we are delighted to introduce not one but two game-changing visualizations, coming in DataMiner 10.4.1: the timeline component and the grid component. Just like our previous innovations, these components are designed to empower you, putting control and creativity at your fingertips.
The timeline component: Your ultimate time-management solution
Imagine a versatile tool tailored for managing bookings, events, and time-bound data with unparalleled ease. Wait no longer, because we’re introducing the timeline component. Designed specifically to simplify the intricate task of managing time-sensitive items, the timeline is an obvious choice whenever your data contains a start and end time.
Whether you’re dealing with appointments, project timelines, or other data that involves time intervals, the timeline component is your go-to solution. Every row in a GQI (Generic Query Interface) result seamlessly transforms into an item on your timeline, providing a visual representation that enhances your understanding and management of time-related information.
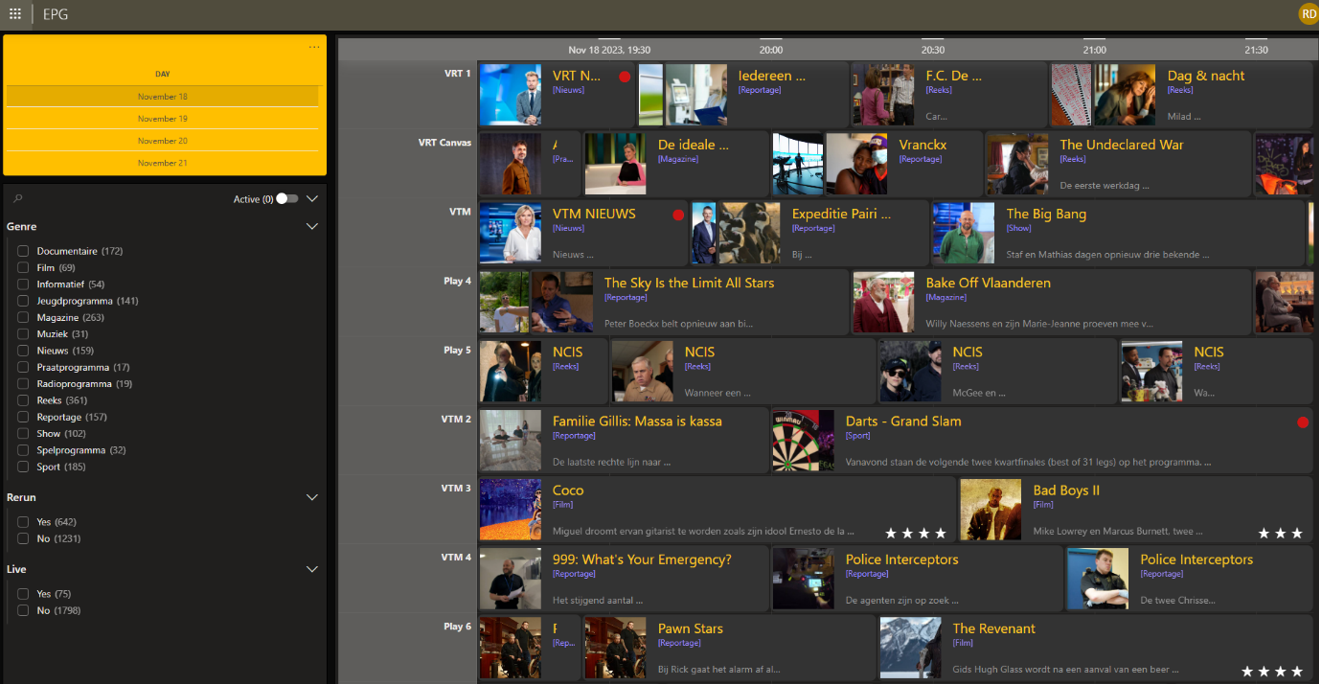
Not only is the timeline component incredibly useful as an overview of any time-bound data, but it also allows for near-unlimited customization with the Template Editor. Below, you find an example of a timeline component used as an interactive TV schedule. The timeline has been styled with customized coloring, icons, conditional actions, and more. The grouping functionality has been used to display the different channels to the left of the component, listing all scheduled TV shows next to the appropriate channel.
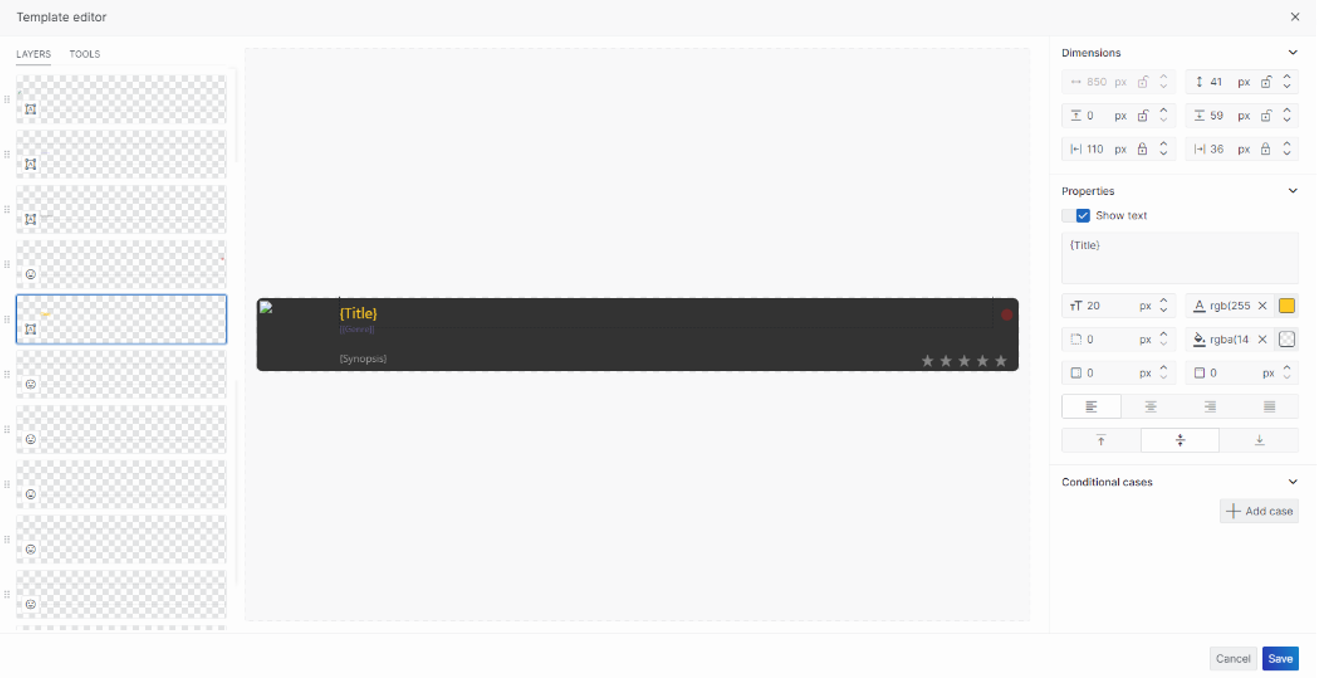
Here is a look behind the scenes. The Template Editor comprises a collection of layers, each with their own customization and behavior. Has this made you curious about the workings of the Template Editor and all its capabilities? Visit our extensive guide in the DataMiner documentation.
Interactive and intuitive
Navigating through your timeline feels effortless. Zoom in for a closer look at daily items, or zoom out for a broader view of your monthly data. The timeline component is not just a visualization tool; it is a dynamic experience that streamlines your data interaction.
The grid component: Where data meets precision
Next in our lineup of innovations is the grid component, your go-to tool for organizing and presenting data with precision. The table visualization is no longer your only option for displaying an array of data now that the grid component has opened the door to a world of customization and efficiency.
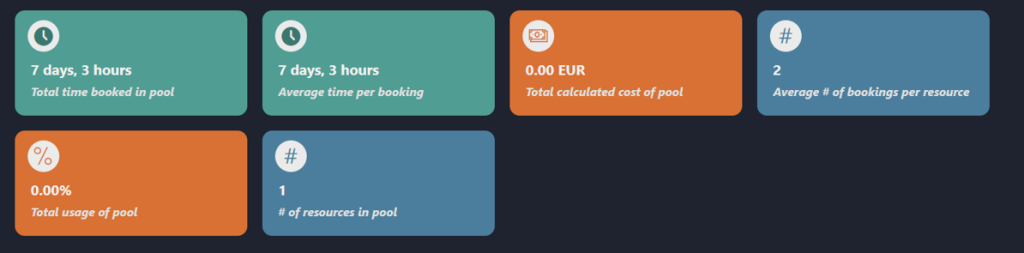
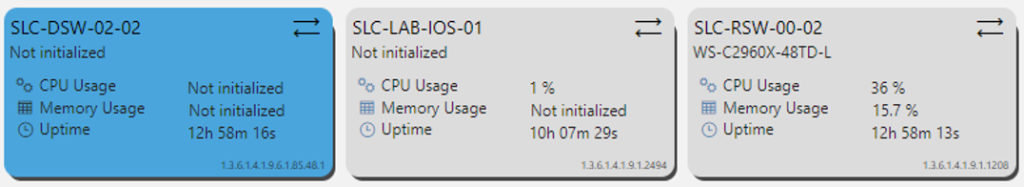
Take a look at this example, showcasing the versatility of the grid component:
Beyond rows and columns
Think of the grid component as a dynamic canvas for painting a vivid representation of your data. It transcends the traditional rows and columns, focusing on creating flexible, dynamic layouts that seamlessly adapt to your needs. Tailor your grid to highlight the most critical information, crafting an interface that speaks directly to your users.
Notably, just like with the timeline component, every row in your GQI result effortlessly becomes an item in your grid. Picture it as a continuous flow – as a row fills with templates, it intuitively transitions to the next row, ensuring a seamless and organized display of your data. This dynamic behavior allows for a visually engaging and informative representation of your information.
Once again, the grid component enjoys far-reaching customization options with the Template Editor.
The Template Editor: Your playground for creativity!
As briefly mentioned above, you can truly unlock the vast potential of the timeline and the grid with the intuitive Template Editor. This powerful tool lets you customize every aspect of your visualizations, from content positioning to alignment control. Vibrant colors, HTML-enriched text, and a library of icons – the Template Editor is your playground for creating visually stunning and highly informative displays. Read more about it in our previous blog post!
Two components, one goal: Elevate your data experience
In alignment with our recent blog post about duplicating low-code apps and GQI queries, we conclude our post by underscoring a shared objective that unites the array of recent enhancements: We are committed to redefining your interaction with the data in your DataMiner web apps.
Our strides in innovation focus on:
- Saving time: Navigate through time and data at unprecedented speed.
- Customizing without limits: Tailor your data representations without any constraints.
There is still a lot more to discover about the timeline and grid components. Not to mention the myriad of possibilities the Template Editor brings to both visualizations. Discover more:
You might also like
BLOG
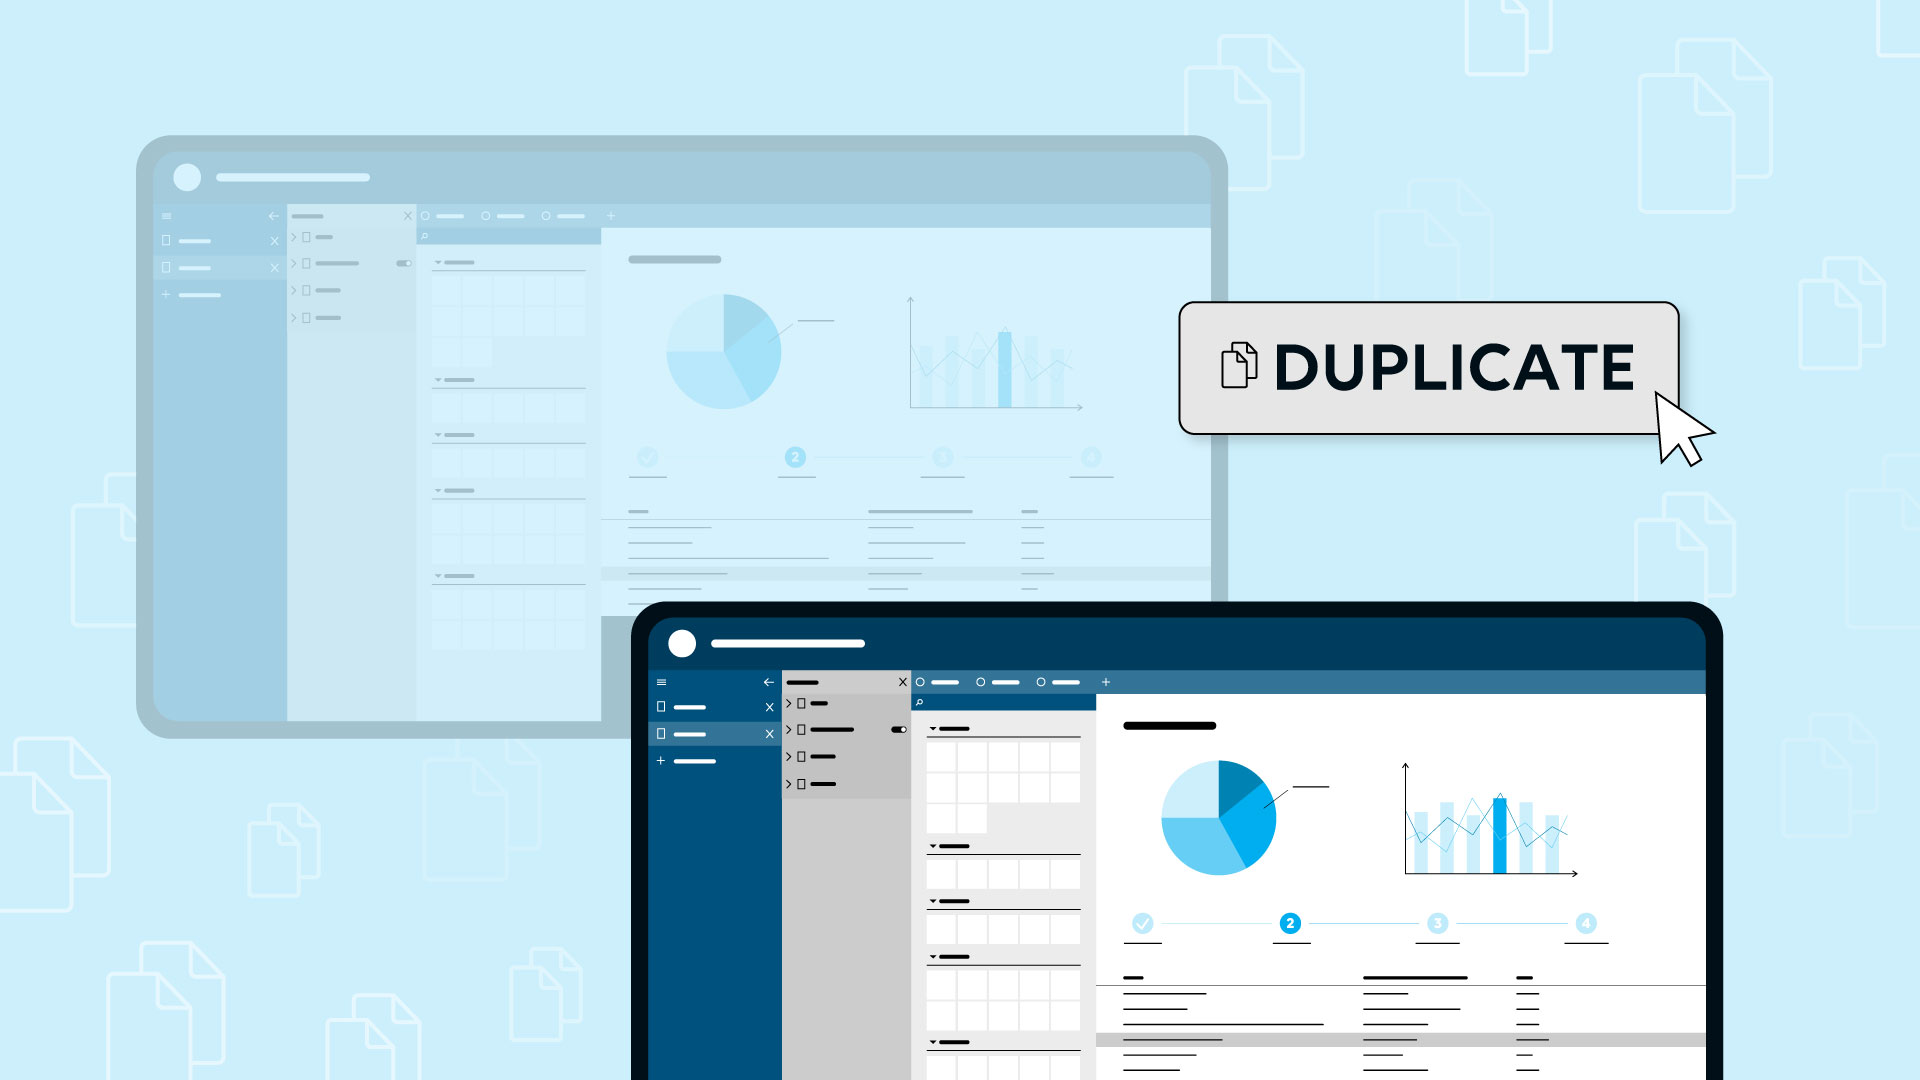
Work smarter, not harder: duplicating low-code apps and GQI queries
Up until now, duplicating highly valuable low-code apps posed a challenge. However, recognizing the undeniable advantages of repurposing apps, DataMiner introduces the capability to duplicate apps starting from version 10.4.1. And it doesn’t end there. Have you crafted a query that you wish to reuse with minor modifications? Use the new query duplication feature!
BLOG
Legacy Reporter and Dashboards retirement
With the release of DataMiner 10.4.0, you are met with both exciting advancements and necessary transitions. The time has come to bid farewell to the legacy Reporter and Dashboards modules, marking the end of their life cycle.