 Robin Debel
User info
| First name | Robin |
| Last name | Debel |
DevOps Program
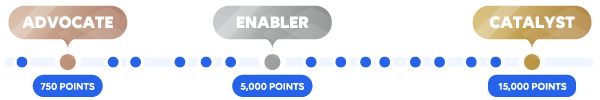
| Acquired rank |
Enabler
|
| Points progress |
2055
DevOps Points
|
 Here are a few tips to level up your DevOps game and unlock an arsenal of perks and benefits. Here are a few tips to level up your DevOps game and unlock an arsenal of perks and benefits.
|
|
| DevOps attestation | Request your attestation ID and expiry date |
Achievements
|
|
Questions asked
Answers given
When creating the pdf under the layout settings, you have an option called 'include feeds'. This wil include the timerange component into the pdf report.
View QuestionHi Jarek, 1: You can use the select operator in GQI to hide columns. Just toggle the columns you don't want to see. 2: You can also use the filter to show the columns you want in the table.
View QuestionHi Tarik, The maps component does not fetch all rows at once. Instead, it retrieves only the rows that fall within the visible bounds of the viewport, along with a buffer. As you scroll, it will fetch...
View QuestionHi Wale, Can you try putting the web page in the 'C:/Skyline Dataminer/webpages/public' map? Kind regards, Robin
View QuestionHi Juan, If I understand correctly, you’d like to pass query parameters that adapt to the selected value in your dashboard to a custom webpage. This is possible by using IntelliSense to interpolate the...
View QuestionHi Felix, I believe the best way to approach this is through a custom operator in GQI that reflects the state of the item. This could add an enum value indicating whether the item is in progress, waiting...
View QuestionHi Ana, The syntax you are currently using to pass the string value is the syntax used to 'feed' a value to a certain component. In the action however you are using the URL Query Param. The documentation...
View QuestionHi Harald, I believe this post will answer your question: Low-code app button won’t push script’s result to clipboard You’ll need to assign the value to a text variable and then interpolate it...
View QuestionHi Donny, There is no specific recommended browser for this. All our web apps are designed to work on any modern browser. If an issue occurs in a particular browser, please report it so we can investigate...
View QuestionHi Gerwin, The images are saved in the following location: Skyline DataMiner\dashboards\_IMAGES. As far as I know, deleting images is currently only possible by accessing the files directly on the DataMiner...
View QuestionHi Gerwin, Sorry to hear the editor is more annoying than helpful. Could you let me know which version you're currently running? At the moment, there’s no way to disable this behavior. In the meantime,...
View QuestionHi Thomas, The blue color is not configurable at the moment. I agree that this would be a useful feature, so I’ll create a task for it on our backlog. I’ll also ensure an update is posted on this...
View QuestionHi Alexandre, No, it is not possible to create a PDF of an application since these can have multiple pages and panels. With kind regards, Robin
View QuestionHi Marco, You can use the query param 'embed=true' to hide the headerbar. Example: 'https://robinde.skyline.local/app/35688057-da15-4720-be2c-cdcd8eddde5c/Page?embed=true' where the '?embed=true' part...
View QuestionHi Baranisudha, I recently saw a similar question with an answer which might help you: https://community.dataminer.services/question/migrate-lca-dom-automation-script-from-dev-environment-to-stage-or-prod/
View QuestionHi Ruben, Since using the Query Filter component creates a new query, it is now not possible to keep the previously configured custom layout. We have plans to change this behaviour and make it easier...
View QuestionHi Wale, This is not possible yet. We do have a task on our backlog to make this feature available!
View QuestionHi Alija This sounds like a software issue. I've gone ahead and created a task for this. We'll let you know here once a fix has been implemented. For now, adding a vertical padding of at least 5px will...
View QuestionHi Ruben, I believe this is the same question that was answered here: https://community.dataminer.services/question/lca-moving-through-ias-panel/ kind regards
View QuestionHi Stacey, Great news, we’ve just implemented this feature. Starting from release 10.5.11, the Clear selection action will be available not only for the timeline but also for grid, map, state (queries...
View QuestionHi Gerwin, If you just want to use a value that is passed via the URL you can use query params like you do in Dashboards, this behavior was introduced to Applications in 10.5.4. You can find the documentation...
View QuestionHi Apurva, I believe you are using a grid component to show the different types of severity. If this is the case you can use the selection the grid component exposes to filter the data from the query...
View QuestionHi Joel, In 10.4.12 we introduced something called 'Variables' in both Dashboards and Low-Code apps. This seems to be exactly what you want. You can find some more info here: Docs
View QuestionHi Marco, Our WebAPIs cache for 1 hour after last visit. From your short explanation however, I believe we have fixed an issue in 10.4.11 that might be what you are experiencing. Could you let me know...
View QuestionHi Miguel, You can only use numeric values as an x- and y-axis. Since you use the CSV reader ad hoc data source, it does not know which column is intended as a numeric value. You can however use this...
View QuestionHi Kris, As Sebastian said, this is not possible as of now. We do however already have a task on our backlog to make this title optional in a future version of Dashboards & Low Code Apps.
View QuestionHey Mieke, Since 10.4.5.0 you can use feeds within the Web component using the "{Feed.xxx}" notation. I did however not find a way to pass a search value via the URL to our docs. Greetings, Robin
View QuestionHi Gerwen, This is a known issue and we already have a task on our backlog. A refresh should fix the issue for now.
View QuestionHi Ömer, For now, only string values can be used as a feed value in the postActions of the Execute a Script action. In the future, we do plan to add support for fetching a query and storing it in a variable....
View QuestionHi Joachim, At the moment, it isn’t possible to reorder the header bar buttons or insert a new one between existing buttons. If this is something you’d like to see, feel free to submit a feature...
View QuestionHi Michiel, Unfortunately, at this moment, there's no way to control this behavior. However, I do believe that in the future, we’ll introduce functionality that offers more control over it. I have created...
View QuestionHi Johan, Thanks for bringing this to our attention. This looks like a software-related issue. Could you please get in touch with tech support about this? They’ll make sure the correct team is notified...
View QuestionHi Maxime, At this time, this is not possible. It is however a long-term goal for us to support this behavior, i do want to note it will not be implemented in the near future. Kind regards,Robin
View QuestionHi Edib, The LCA framework doesn’t have a built-in way to do this. However, a quick Google search led me to some browser extensions that cycle through open tabs, such as TabCarousel. While we don’t...
View QuestionHi Apurva You can reorder columns using the Select operator in the GQI query builder. This way you can make sure the most important columns are on the left of the table. You can scroll easily to the...
View QuestionHi, To quickly check the status of elements, you can create a GQI query using the 'Get Elements' data source and apply a Select operator to include the Alarm State column. However, retrieving element...
View QuestionHi Jarek. The simple answer is it is not possible to do this in the GQI Table. You could however feed the selected row of the GQI table to a parameter table and in this way keep the ability to click...
View QuestionHi Alexandre, Yes, this should be possible by stringing a few features together. One possible approach could be: Add a notes column to your data source (for example via an ad hoc datasource if needed...
View QuestionHi Harald, This setting is specific to Cube. In DB/LCA, the datetime format used in the timepicker component is fixed to dd / mm / year hh:mm". If you would like to see this configurable or supported...
View QuestionHi Hari, I see you are using the Interactive Automation Script component. This component has an On Finish event that is triggered when the automation script finishes. In this event, you can configure...
View QuestionHi Alexandre, Unfortunately, to my knowledge, none of the three options you mentioned are possible at this moment. If you would really like to see these implemented, I suggest creating feature requests...
View QuestionHi, The value for UTC should be this: { "Name": "commonServer.ui.DefaultTimeZone", "Value": "UTC;0;(UTC) Co-ordinated Universal Time;Co-ordinated Universal Time;Co-ordinated Universal...
View QuestionHi Felix, As of now there is no way to enforce this by default. In the future these inputs will become the default. Kind regards, Robin
View QuestionHi Alexandre, At the moment, it’s not possible to disable this behavior. However, we’ve added a task to implement a setting that will allow users to toggle these points of interest. I’ll ensure an...
View QuestionHi Felix, Happy to share we've just merged the feature which allows you to have actions on text shapes. The change will be included in the 10.5.5 web release.
View QuestionHi Marco, I wanted to update you that we've just merged a fix for the issue you encountered. This fix will be included in the 10.5.3 release, and a web-only upgrade will be sufficient to apply it. Let...
View QuestionHi Daniel, For GQI data, as of now there is no way to achieve this... We have a task on our backlog to introduce the ability to set a static Y-axis range. When this feature is implemented we will let...
View QuestionHi Alija, I do not immediately have an idea on what causes these errors. I suggest you get in contact with tech support so when can help you with this issue. With kind regards,
View QuestionHey Marco, There is indeed some logging available for Low Code Apps. At C:\Skyline DataMiner\Logging\Web\Client you can find the files. You can find loading times of dashboards & pages and any console...
View QuestionHi Bing, As of now there is no way to easily do this. You can however go into the dashboard json, copy the query and put it in the json of the application.
View QuestionHi, It is possible to change the color of lines in a linechart: 1) Select the linechart 2) Open the component layout settings 3) Under the styles tab click the ‘customize’ toggle 4) Click color ->...
View QuestionHi Marco, Could you clarify which filter you’re referring to here? If you mean a text or search input, this documentation might help: - Specifying data input in a dashboard or app URL Alternatively,...
View QuestionHi Hari, This looks and sounds like a software issue, please get in contact with tech support (support@dataminer.services) so they can look further into this issue.
View QuestionHi Carl, Currently, there isn't an option to achieve this via a dropdown. However, you could create a button for each page and use the 'Open a page' action on said button to navigate to them. If you're...
View QuestionHi Hari, I believe this is a known issue in that version of the software. It was resolved in version 10.5.4. A web-only upgrade will suffice to fix the problem. We also made additional improvements to...
View QuestionHi Juan, You can access URL data via the URL section under the All Available Data tab. From there, you’ll need to take the TEXT field and drag it onto the component where you want to use this value.Passing...
View QuestionHi Apurva, I believe this is the setting you are looking for Default time zone. The value for UTC should be this: { "Name": "commonServer.ui.DefaultTimeZone", "Value": "UTC;0;(UTC)...
View QuestionHi Koen, Wanted to let you know this feature will be included in the release of 10.5.2. You should be able to access the dmaip value by using {URL.DMAIP.Value}. With kind regards
View QuestionHi Johnny, Could you be a bit more specific on what scale you mean specifically? What is the use case you have in mind?
View QuestionHi Ana, As of now there is no way to do this. You can have a default range for the time range component by going to settings and under general you have a dropdown called 'Default range'. If you want...
View Question