We are using a directional antenna on a rotator which feeds into a Cell Signal analyzer. The dashboard we created shows the trend of the rotator angle and the readings from the analyzer. The final part of the dashboard shows the correlated analyzer to the rotator angle. When on a site with limited RF interference this worked great. However, when we got a site with more cell towers and PCI readings being returned the dashboard is taking an extended time (over 3 minutes) to load if it displays at all. Is there a better way to correlate data between two elements trend results than what is shown below?
At the moment we are using the following GQI with the join function:
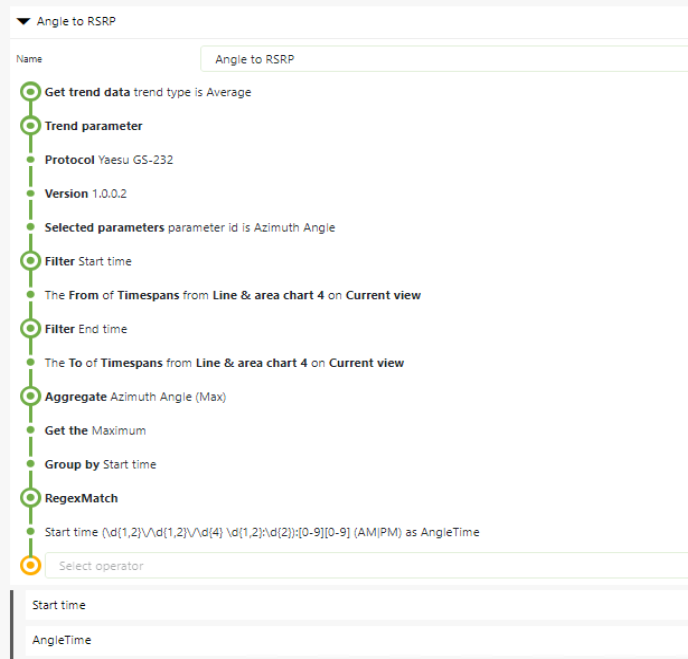
Step 1 – AngleToRSRP collects the Trend Data from the rotator and sets the Start time to hh:mm to avoid mismatch on seconds. Thought about taking this further to group at 10-minute intervals.
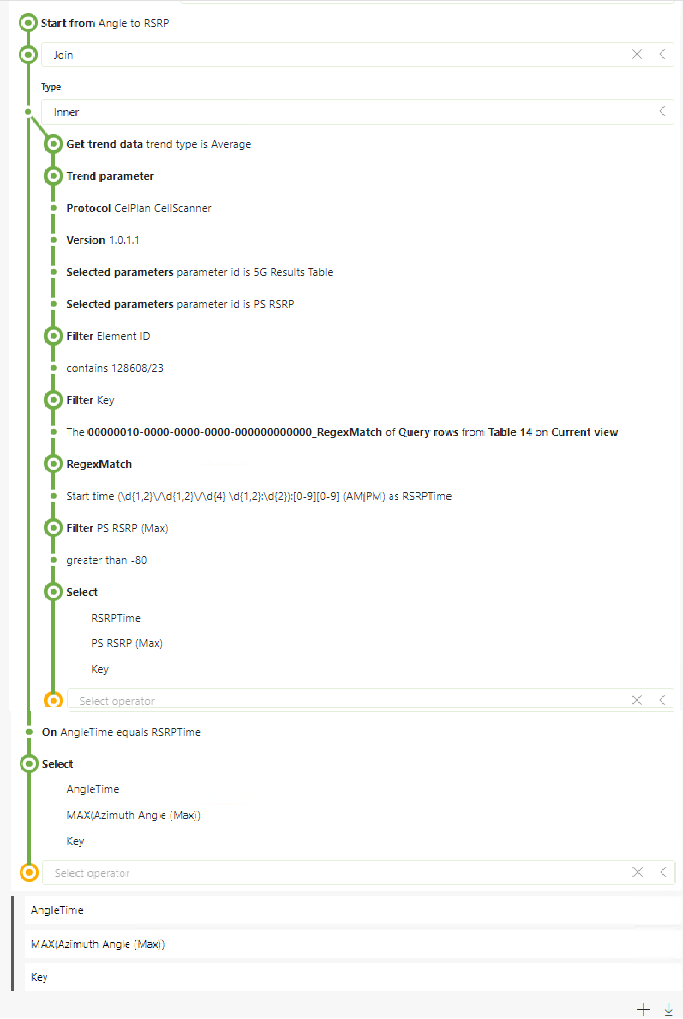
Step 2: AngleToRotator2, joins the rotator trend with the CellScanner trend data
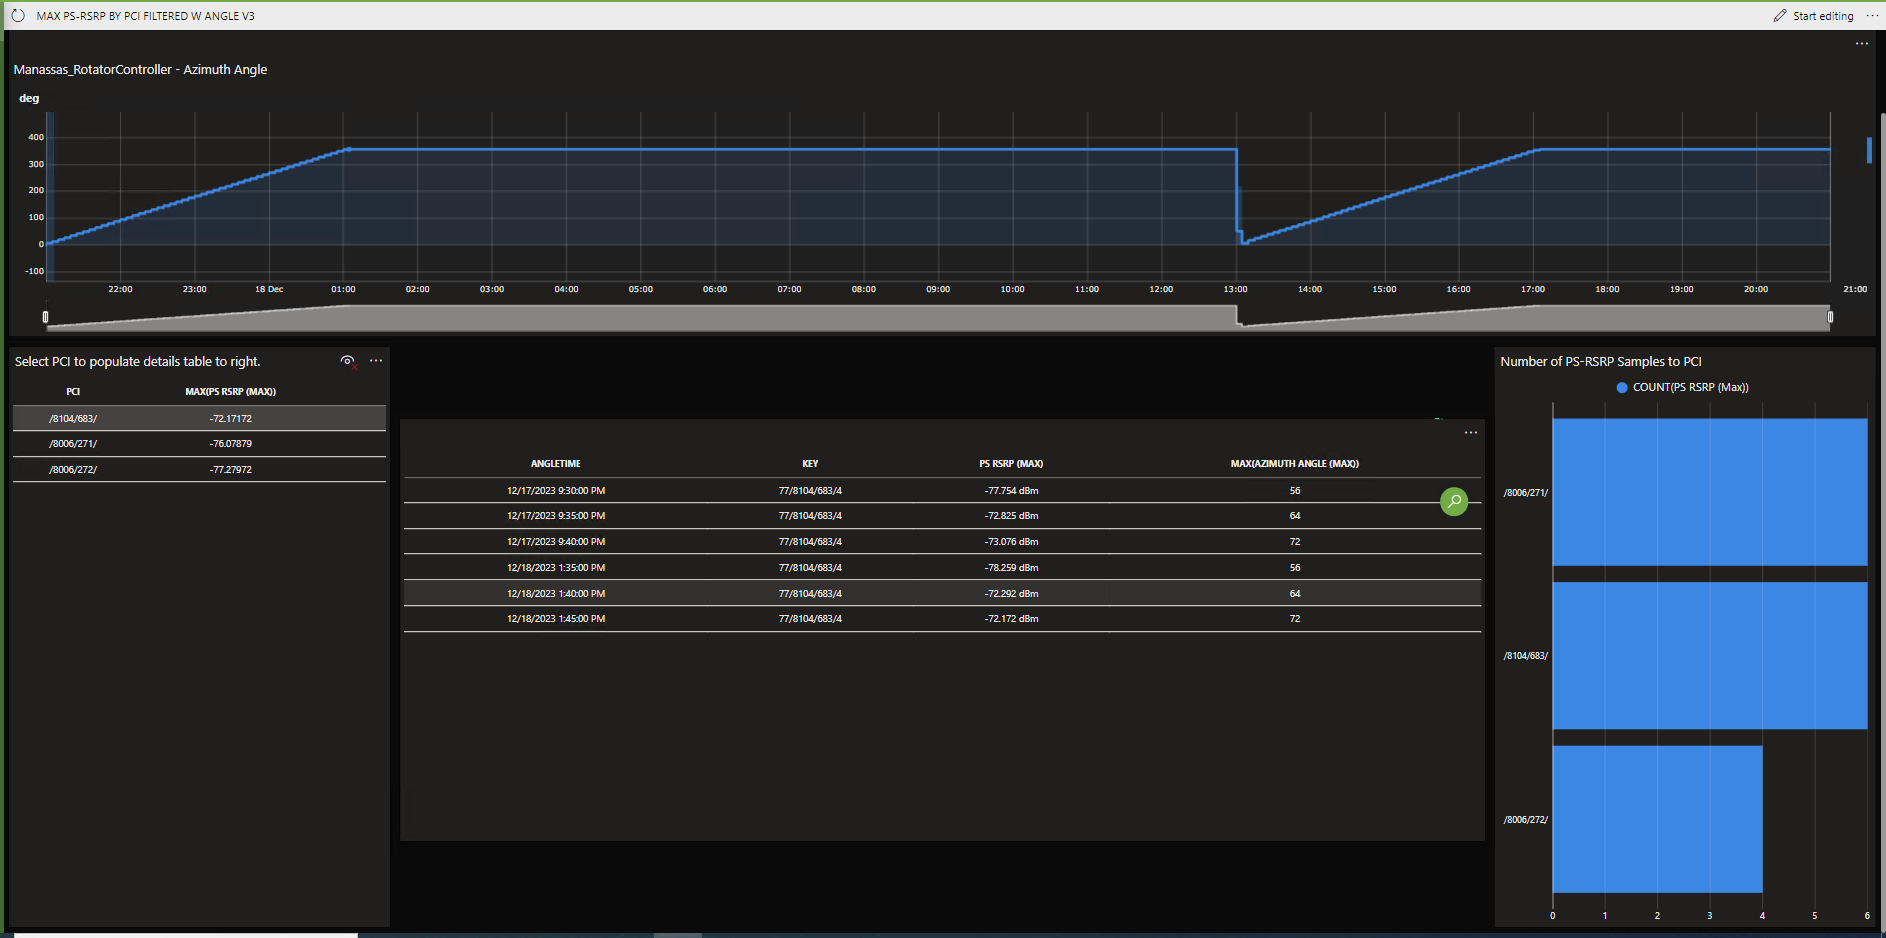
Resulting display, the center table shows time, angle and analyzer reading based on PCI selected from left table. The two side shapes take 3 minutes to populate, then the center table takes another 5 minutes to populate.
Hi Steve,
I think the main performance hit will be the following:
Currently the filter on ElementID won’t get executed efficiently, since it will apply postfiltering. We have following task on our backlog to make it more efficient: https://collaboration.dataminer.services/task/193453
In order to better understand what takes most time during the execution of these queries, we would need to have a GQI recording: https://docs.dataminer.services/user-guide/Troubleshooting/Troubleshooting_Flowcharts/Troubleshooting_Process_Identification/Other_processes/Troubleshooting_SLHelper_exe.html#recording-a-gqi-session
Feel free to provide the recording to us through support.data-exploration@skyline.be
Best regards, Ward
Hi Steve,
What you could do to give the user, who loads a dashboard and hopes to see the end data in not too much time, is the following:
- Since you are working with average trend data in the two GQI-formula’s it is not real-time data anyway. What you could do is “convert” this GQI-formula into a Data Aggregator Query and let this Data Aggregator calculate this data and write it to a csv-file e.g. once every hour. A good file location to write to would be the C:\Skyline Dataminer\Documents – folder, as this is synced across your cluster and with the Data Aggregator, you do not have control on which agent your query is executed. In your case, it could also be that it is better even to make two separate queries and write to two csv-files.
- As a last step, with an Ad Hoc Data Source, executed at the “load-time” of the Dashboard, instead of getting all the raw average trend data, the “pseudo-live” data could already be prepared in csv’s and the user would get a more likeable user experience.
The impact on the “computation capacity” of your system might be low as the work is spread over your cluster. There is more development work, but it will pay off as you get a more stable and reliable computation and user experience.
I chose to answer this question, as it reminds me of a very similar problem we experienced and that was the alternative way we were able to tackle it. So I hope this can also help you.
Kind regards,
Joachim