Hello Dojo,
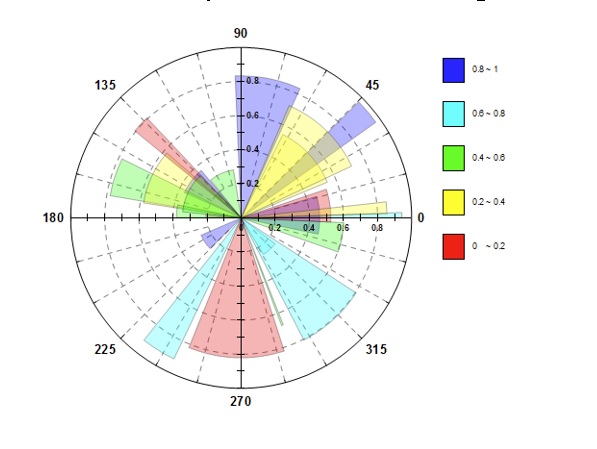
We have a table in Dataminer which is collecting power readings relative to bearings to a tower. Are there any examples or any way we could present this data with a Visio drawing in a Polar Graph type display to identify the direction with the highest power reading?
Marieke Goethals [SLC] [DevOps Catalyst] Selected answer as best
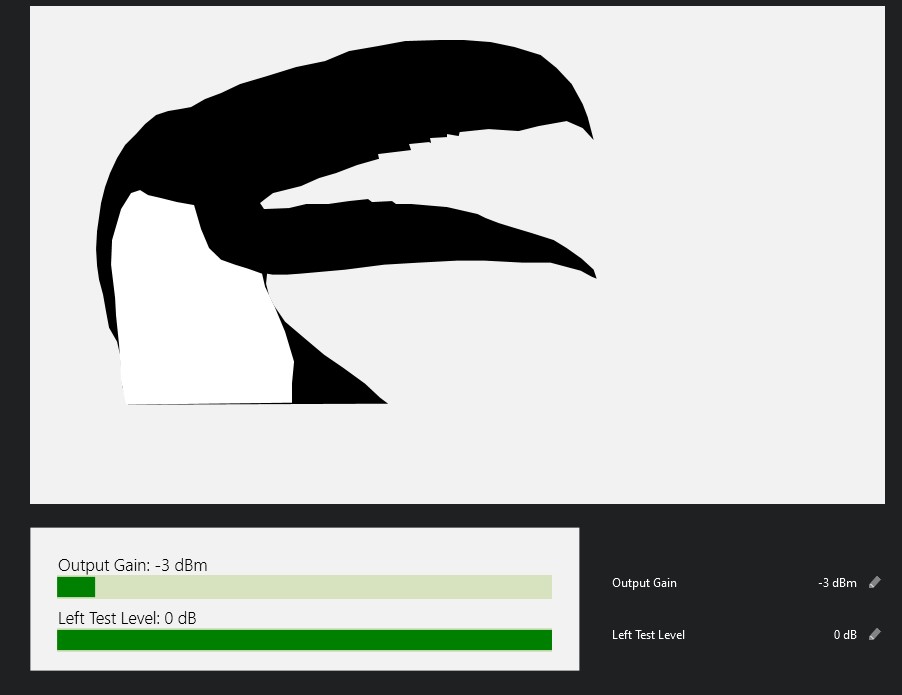
Below some illustrations based on Path Tracing. The LED bars below are completely generated with this, and dynamically update with the value. And the other is a Tucan, because... just because it is possible to draw anything with this feature.
Ben Vandenberghe [SLC] [DevOps Advocate] Answered question