Hello Dojo,
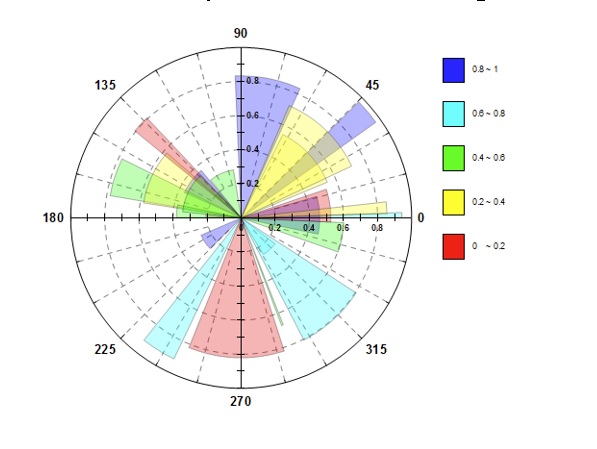
We have a table in Dataminer which is collecting power readings relative to bearings to a tower. Are there any examples or any way we could present this data with a Visio drawing in a Polar Graph type display to identify the direction with the highest power reading?

It would require a bit of coding to write an algorithm to create the shape, but the Path Tracing capability of Visual Overview would definitely allow you to accomplish this. https://docs.dataminer.services/user-guide/Basic_Functionality/Visio/making_shapes_display_info/Making_a_shape_display_a_custom_drawing_using_Path_markup.html
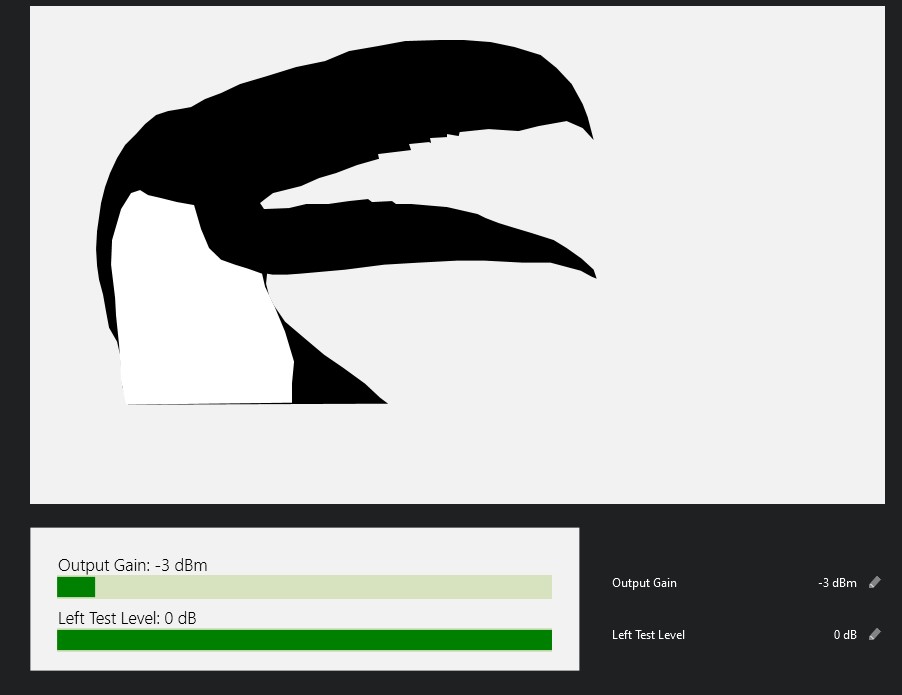
Below some illustrations based on Path Tracing. The LED bars below are completely generated with this, and dynamically update with the value. And the other is a Tucan, because… just because it is possible to draw anything with this feature.
