Hello,
Need to have a simple email report for clients presenting:
- an element list
- Per element, the average value of a parameter (Daily, Weekly, Monthly values). This parameter value is obtained from a collumn from an SNMP table.
Although this seems to be simple to do, is reveling to be quite a challenge..
Can you help?
Thank you.
Best regards
Bruno Sousa
Dashboards is a flexible tool that allows you to configure the dashboard tailored to your elements in your cluster or have a generic approach based on feeds that allows you to have a more dynamic visualization.
I'm a fan of generic approaches.
With regards to #1, this can be done by with these steps:
- Adding a Feed with a protocol list
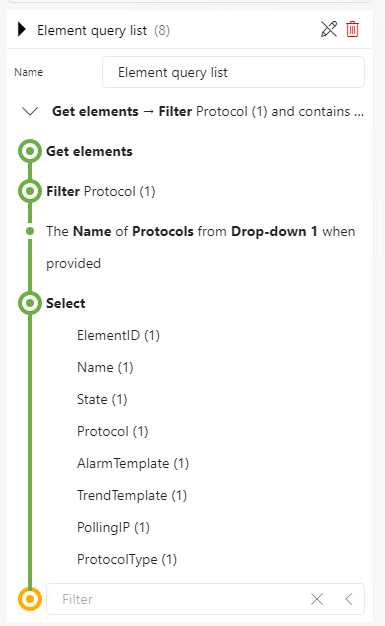
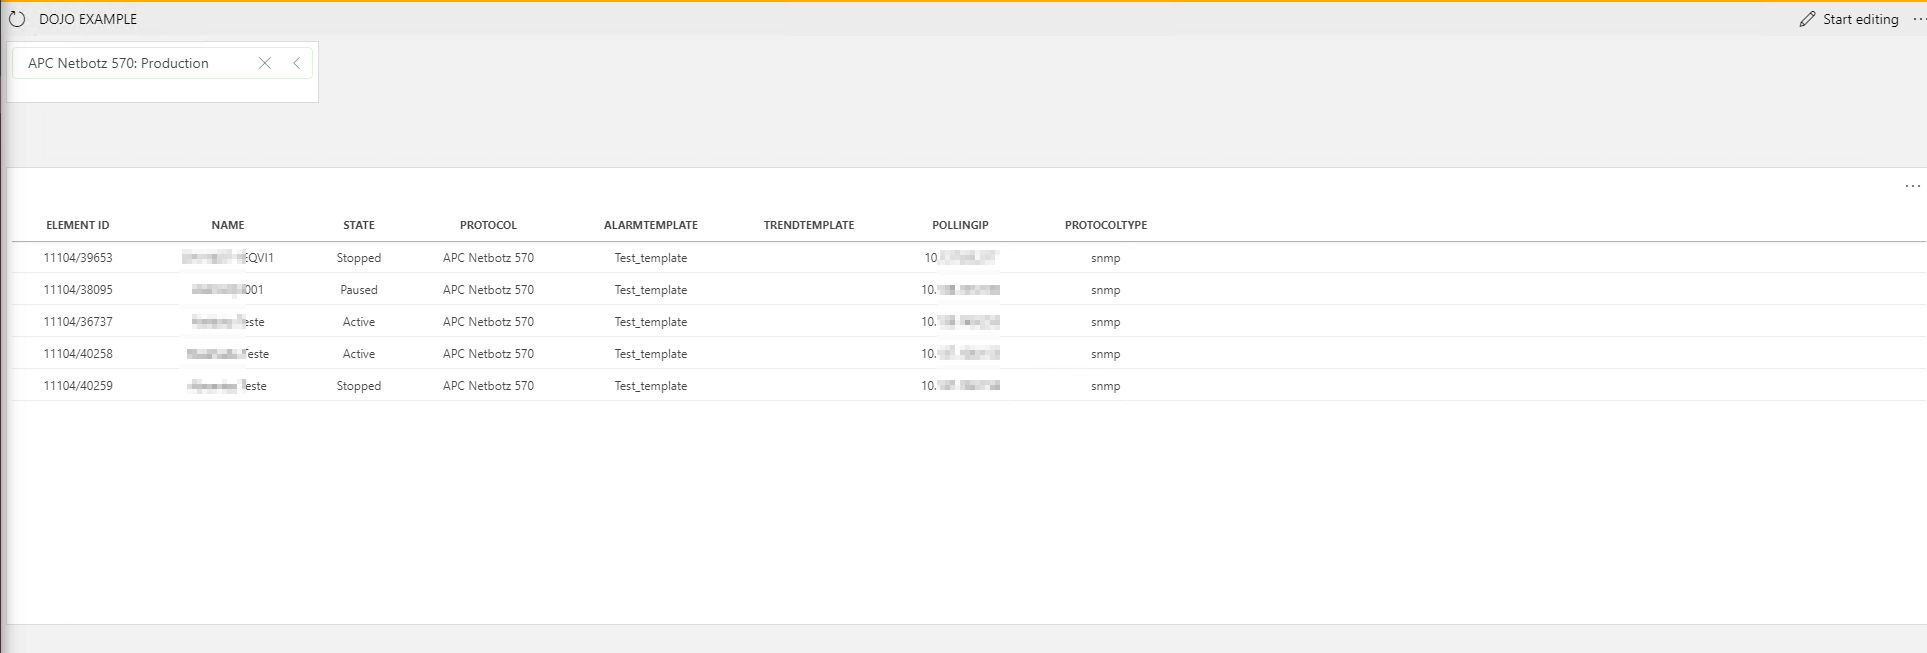
- Start a query where you get elements, filter by the previous drop down and display it in a table. Then, you can add a Select state in your query to fine tune what data you want to display per element.

The result is:

About item #2, I couldn't see a way to do it fully generic, but you can still use GQI to display parameter values:
- Start a query with 'Get Parameters' option and select a protocol and the parameter would like to see
- Visualize this in a table
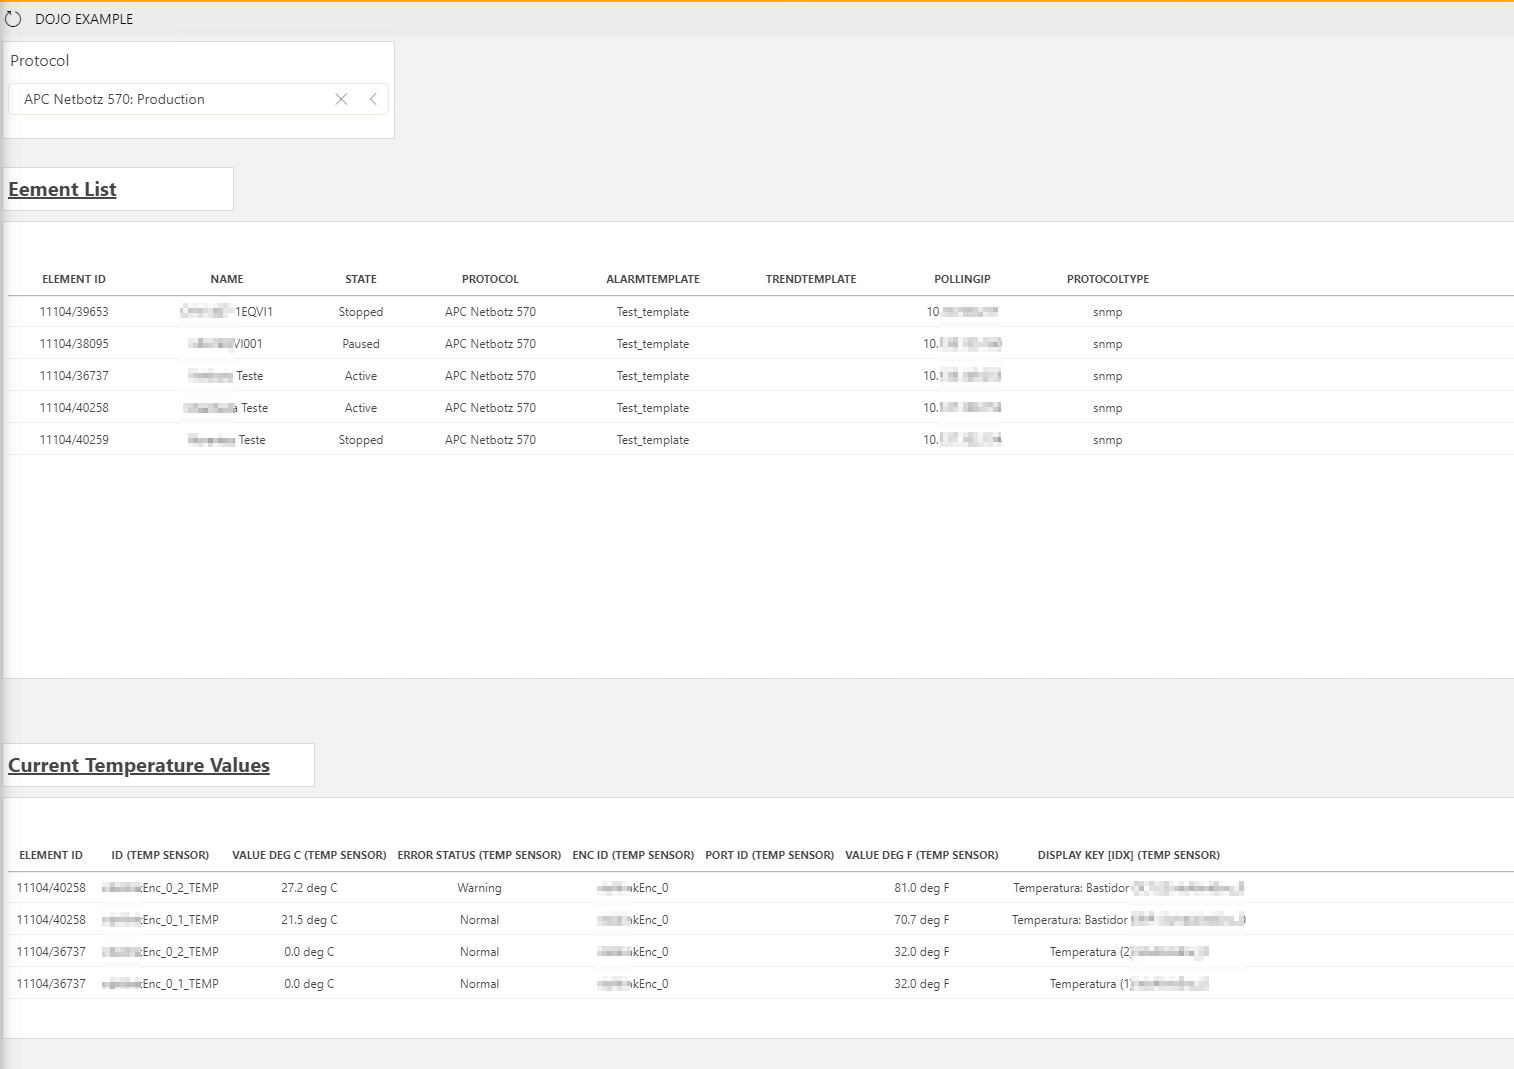
Then the final result would be:

Also note that using GQI with Join command, you can combine different information in the same table like parameter + element information.
With regards to the Daily, Weekly, Monthly values, GQI can aggregate values and calculate averages, count, percentiles, max, min and others. But, as far as I know, this is for data accessible in a table.
Hi, you can do that by using the ‘Select’ operator which selects the columns that should be available. Regarding the average value, we currently only support this for a single parameter table. Note that this is still behind the ‘GenericInterface’ soft launch option. The idea is to expand the functionality for the ‘Get parameters for elements where’ data source as well but this is currently on the product backlog.
Thank you both for your comments and feedback!
In parallel we are also exploring the “report” by email, to give visibility to some teams in a more general way.
How can I format a “report” so it only sends the columns that I want of the SNMP table?
In the present I am sending all of the parameters from the SNMP table..
Thank you.
Best regards
Bruno Sousa
If your table is coming from a GQI query you can use the ‘Select’ operator to choose the columns that you’re interested in.
Bruno,
You can find further details on how to generate a report based in a dashboard on this documentation page: https://docs.dataminer.services/user-guide/Advanced_Modules/Dashboards_app/Generating_a_report_based_on_a_dashboard.html
Bruno,
Thank you for the reply!
One doubt:
Suppose I want to join two tables by element ID (one table has the element properties such as the name and the other the parameter values)
How can I hide the “element ID” column (or at least don’t show it in duplicate in the “final” table..)?
Thank you.
BR
Bruno Sousa