Hi Dojo,
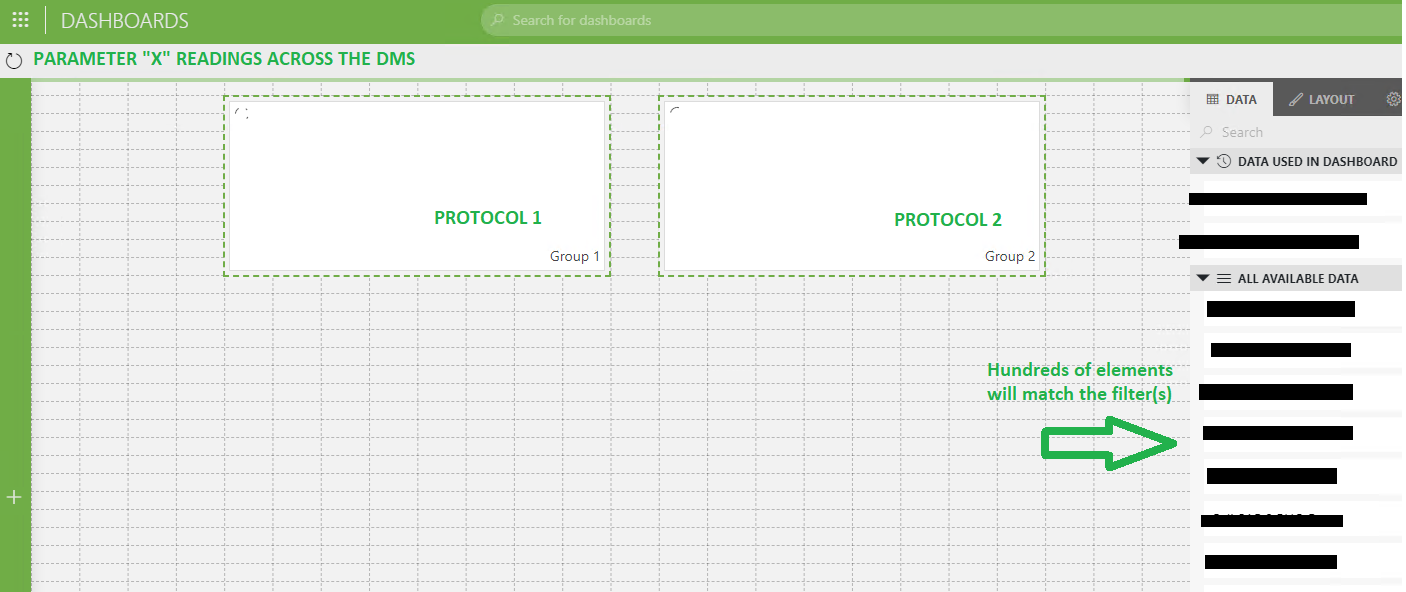
I’m looking for a quick way to configure a live (real-time) overview in the new “Dashboards” module of a specific parameter “X” so that for any elements in my system belonging to 2 specific protocols (let’s say Group 1 & Group 2), the dashboard can extract the value and show it next to the element name – ideally, also the trend in the last 24h

If I drag & drop elements as in the above mock-up the configuration would be for each item on the grid – any other recommended way (as well as links to video) to quickly achieve the result (perhaps with a GQI configuration?) would help.
Periodically (e.g. once a week) I’d like also to generate a templated email report with the readings.
Posting here to get insight from more experienced Dashboard creators.
Thanks
Hi Alberto,
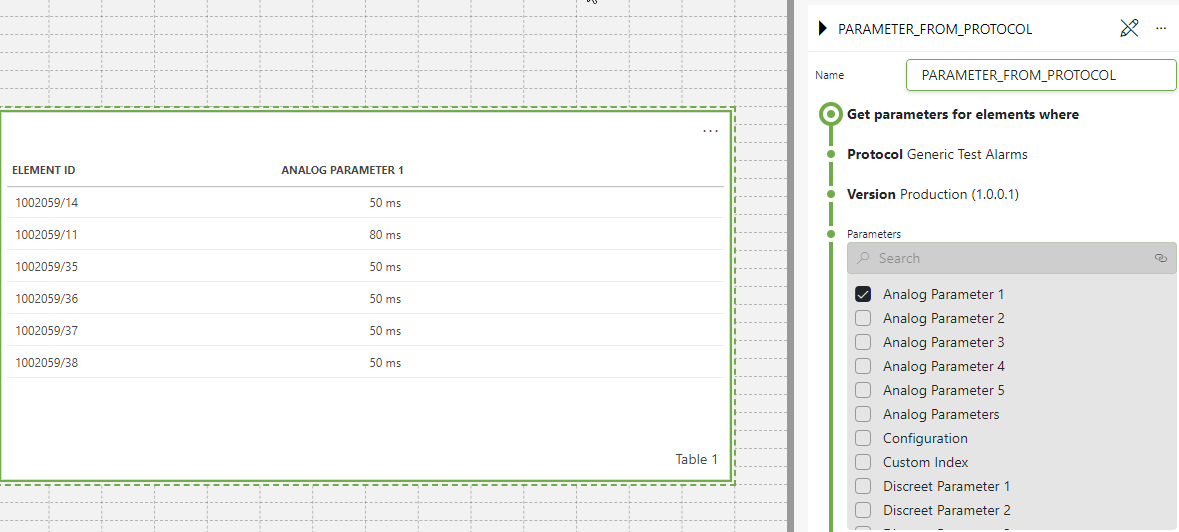
Maybe a possible option could be using a GQI query that gets data from a parameter using a specific protocol (using the data source Get parameters for elements where):

The result of this query is the value of the parameter selected for each element using this protocol.
Hope it helps.
Tanks Miguel, this was a useful spark
Had to get some more help from the squad, but once the source view
(=DMA /source of elements) got inserted, the data started to come through.
marking as solved
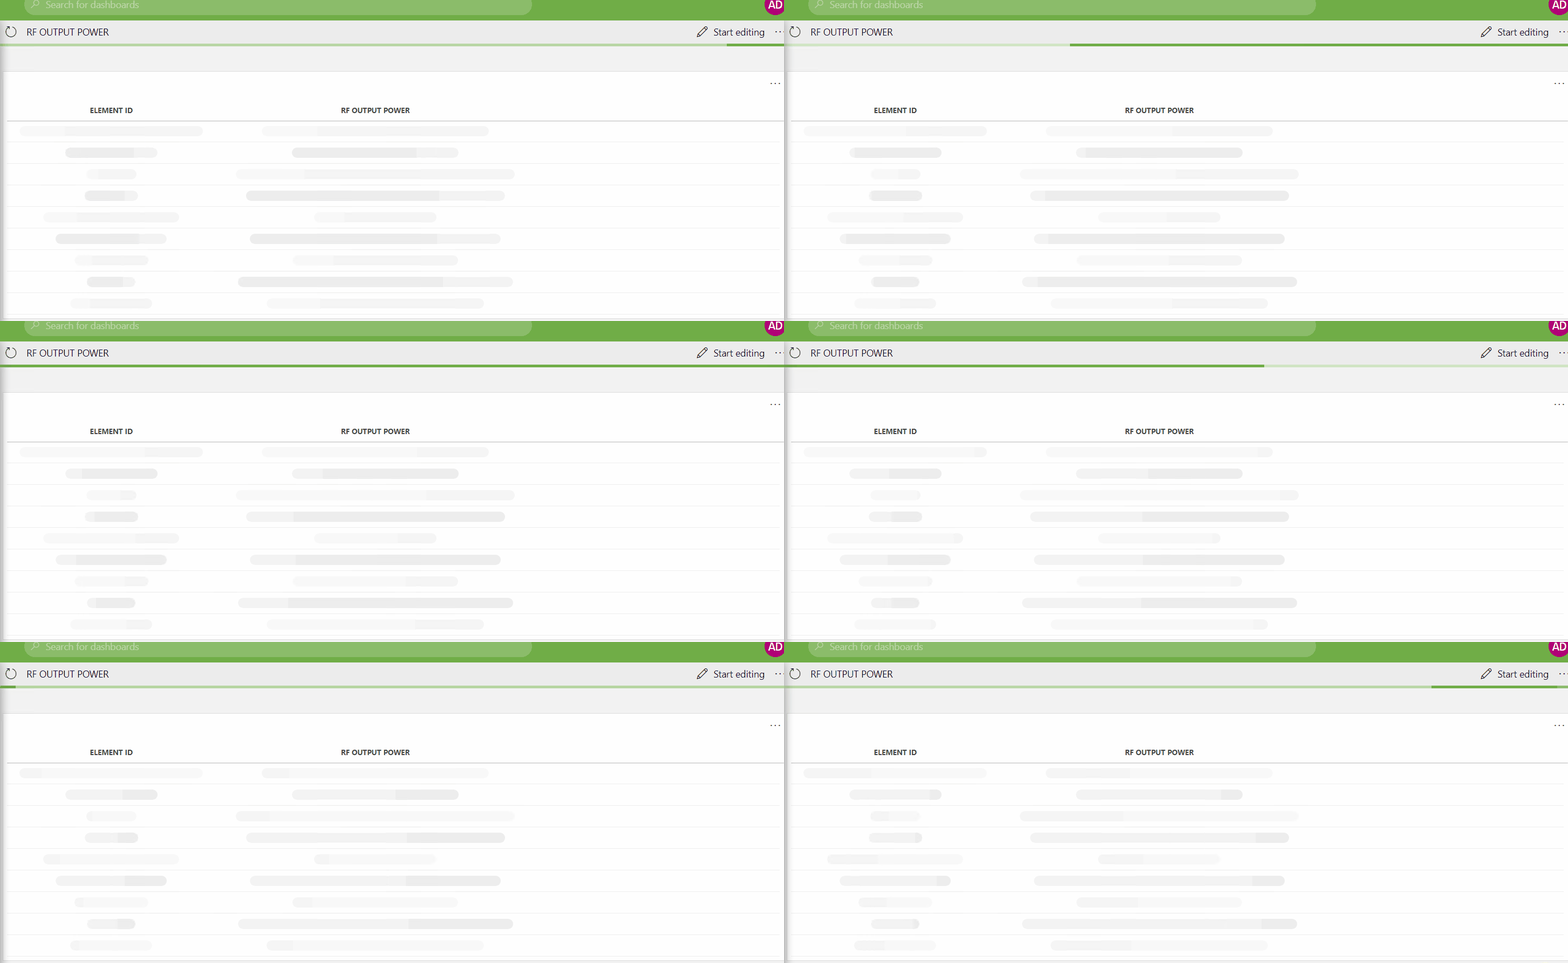
Sharing some more screenshots as the dashboard seems stuck loading:

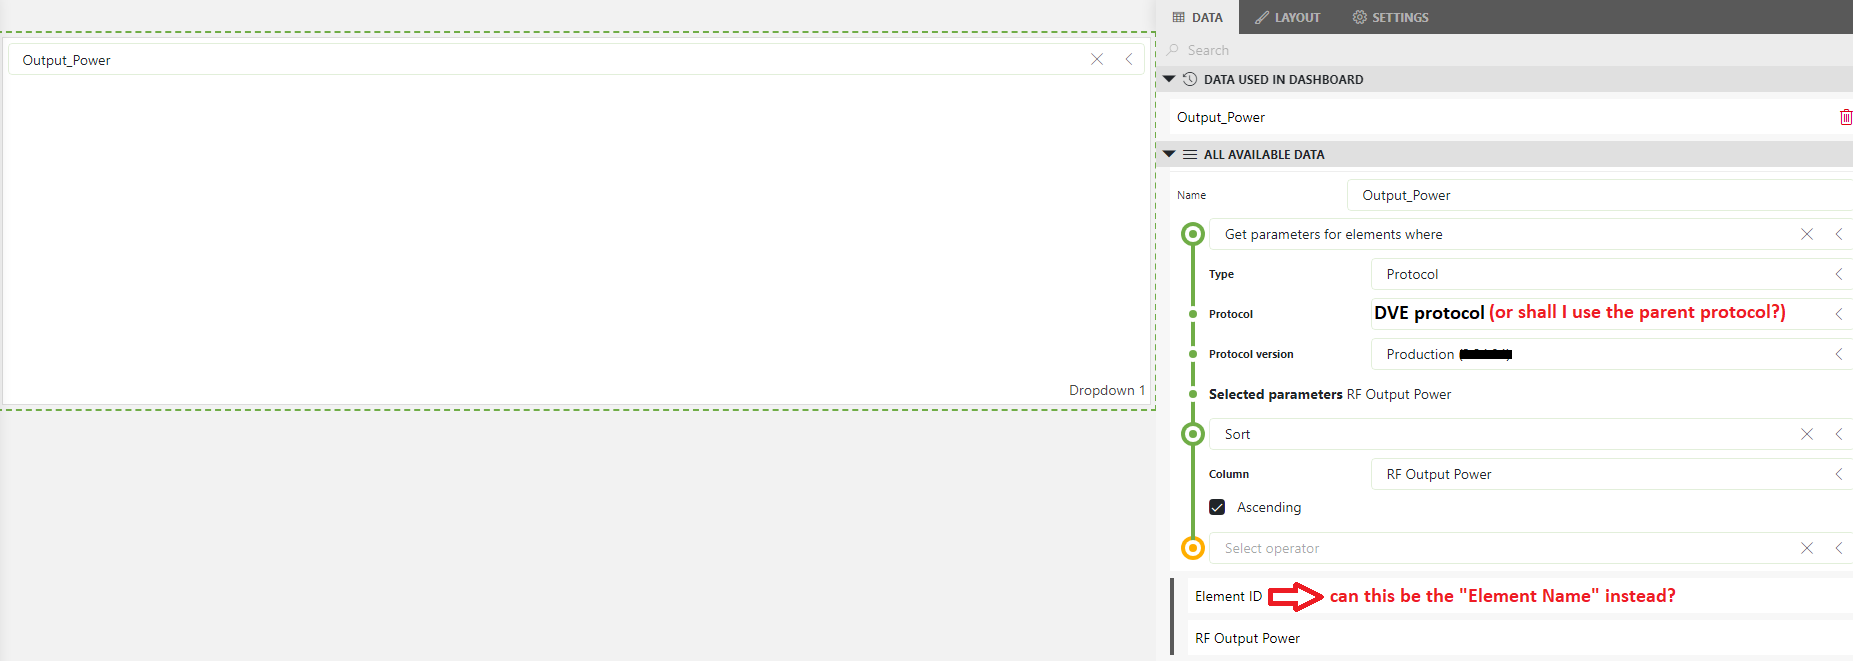
Perhaps I need to something missing in these options:
can I use a DVE protocol or should it be the protocol for the parent elements?

And is there a way to get the element name instead of the element ID via this data source?
Thanks
Hi Alberto, we significantly improved the performance of these queries from 10.4.0 onwards (for tables) and 10.4.0 (CU3)/10.4.6 onwards (for standalone parameters). On which version is this running exactly?
Currently still on 10.3 but thanks for sharing, @Sebastiaan
Will check this too once on 10.4 or newer
Thanks for your help, Miguel – appreciated – I’ve tried this and this data source seems to be the one I needed – but I’m not getting data just yet: sharing below the sample for this quick mock-up – anything still required in the config to get the readings?
As for a templated report, is there any recommended way to get the readings at a given point in time and email these, as done in the past with the legacy Dashboard module & the scheduler?