Hi Dojo,
I'm looking for a quick way to configure a live (real-time) overview in the new "Dashboards" module of a specific parameter "X" so that for any elements in my system belonging to 2 specific protocols (let's say Group 1 & Group 2), the dashboard can extract the value and show it next to the element name - ideally, also the trend in the last 24h
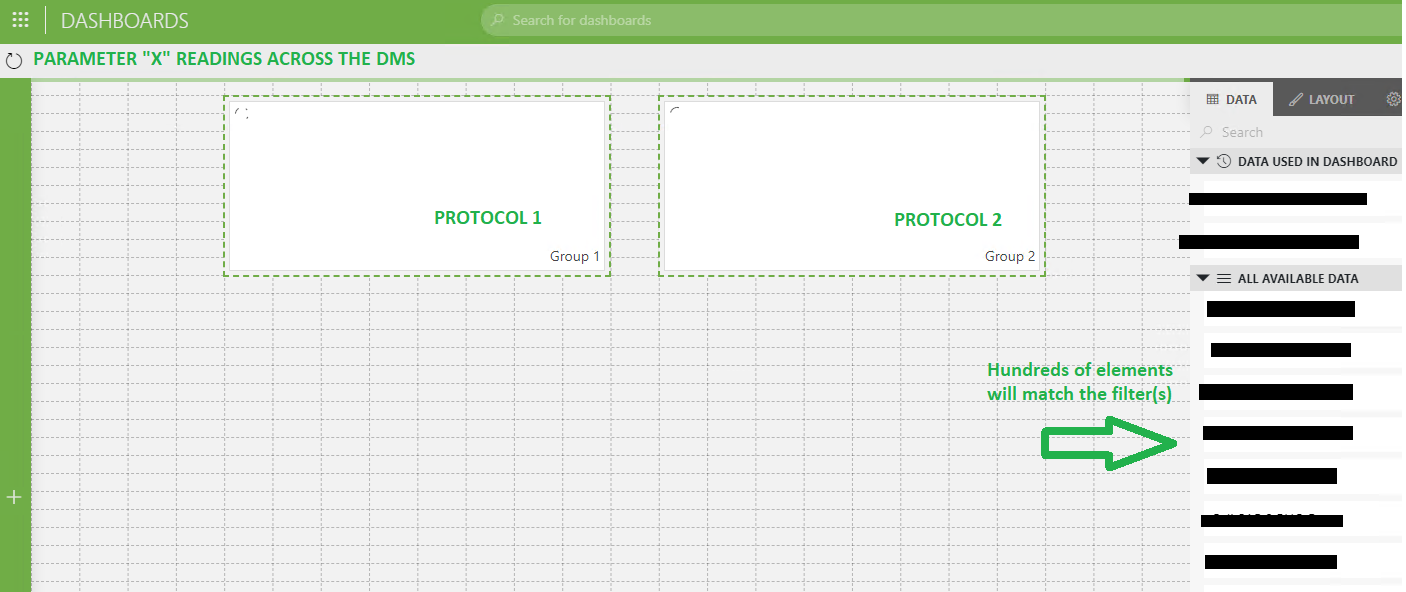
If I drag & drop elements as in the above mock-up the configuration would be for each item on the grid - any other recommended way (as well as links to video) to quickly achieve the result (perhaps with a GQI configuration?) would help.
Periodically (e.g. once a week) I'd like also to generate a templated email report with the readings.
Posting here to get insight from more experienced Dashboard creators.
Thanks
Sharing some more screenshots as the dashboard seems stuck loading:
Perhaps I need to something missing in these options:
can I use a DVE protocol or should it be the protocol for the parent elements?
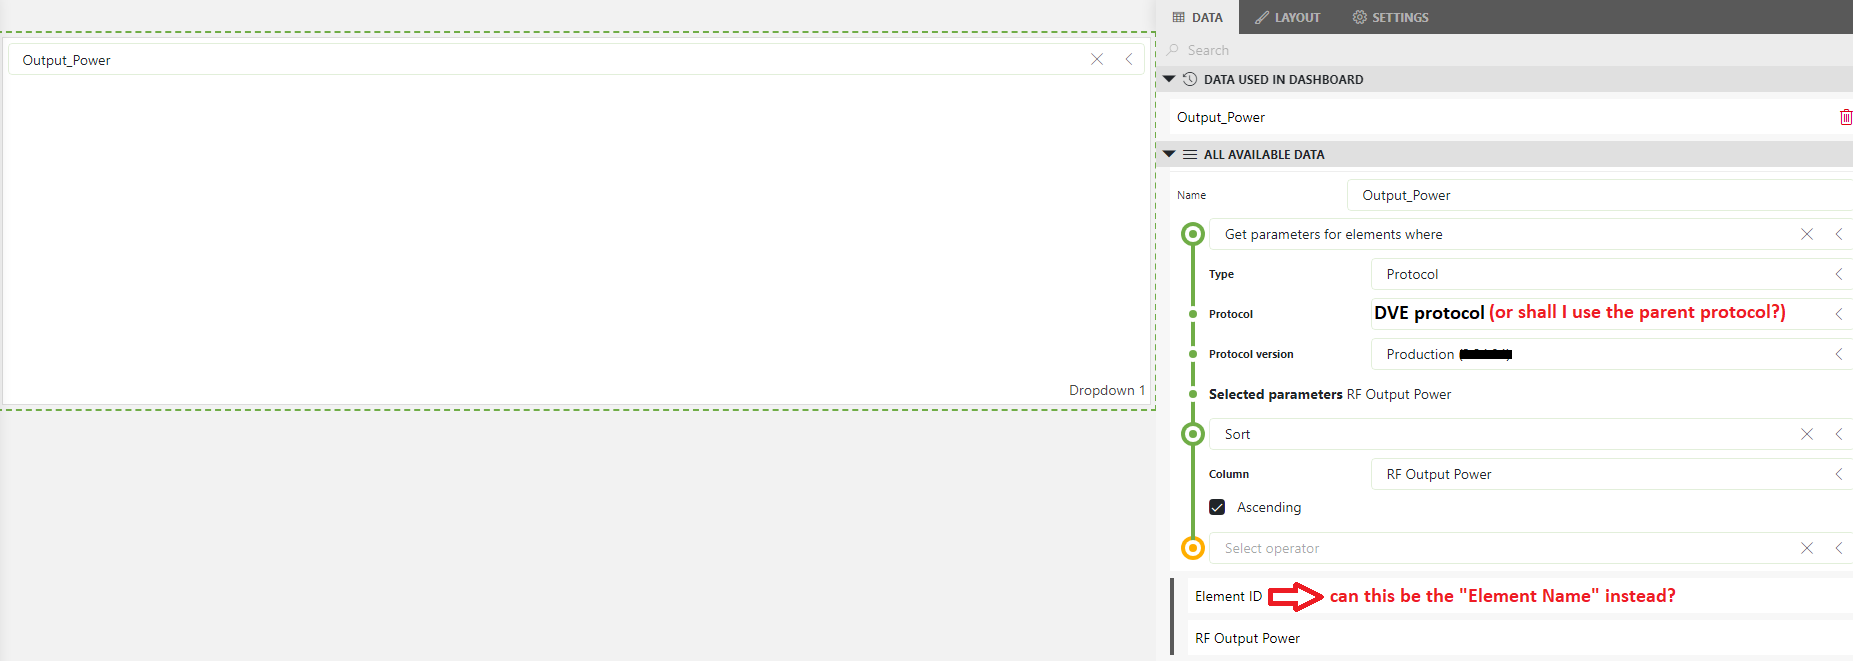
And is there a way to get the element name instead of the element ID via this data source?
Thanks
Currently still on 10.3 but thanks for sharing, @Sebastiaan
Will check this too once on 10.4 or newer
Hi Alberto, we significantly improved the performance of these queries from 10.4.0 onwards (for tables) and 10.4.0 (CU3)/10.4.6 onwards (for standalone parameters). On which version is this running exactly?