Hi!
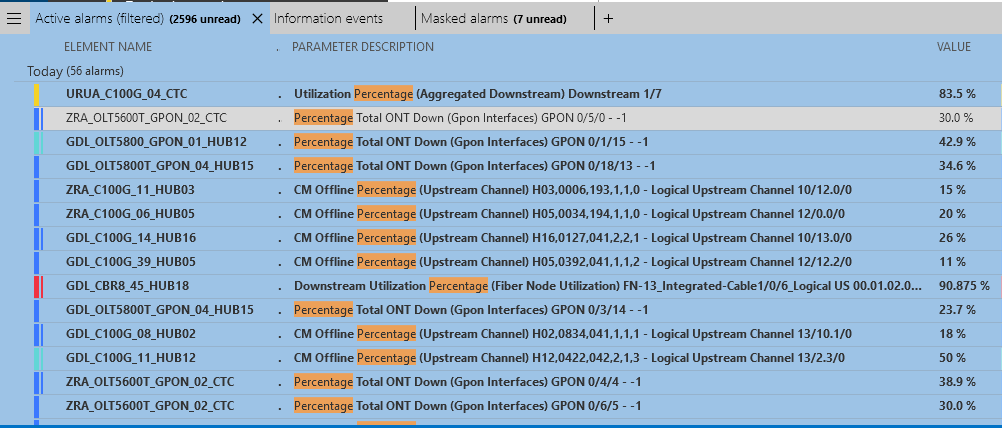
In several "Big" operations based on HFC and IP services, we have an issue when troubleshooting the alarms generated by parameters containing percentage values (%)

Given the number of alarms that these systems generate, it is required to know the number to which these percentages refer to. As you can imagine, the percentage of a channel with 20 subscribers is not the same as that of a channel with 200.
This information will be used to prioritize the alarms that are not too big to cause a massive failure and too small to be discarded.
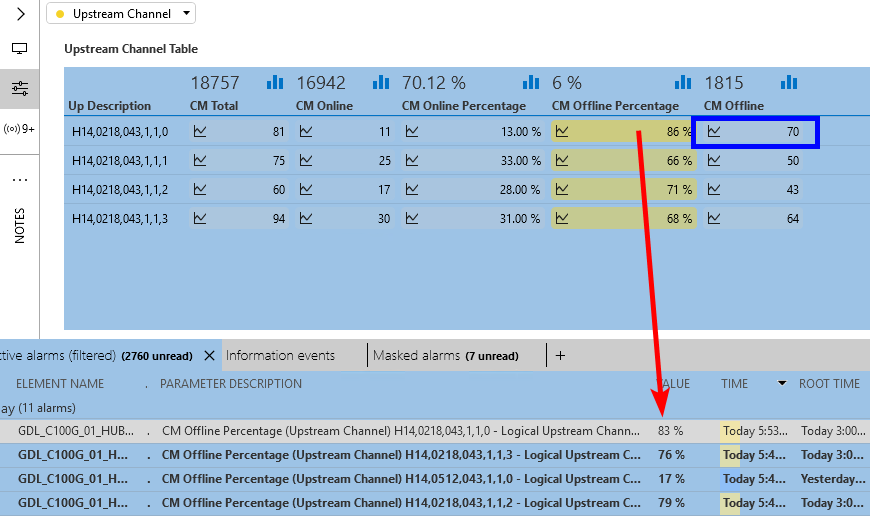
[EDIT] For clarification purposes, I'm adding a picture with the value that we see today (red arrow) and the desired value that needs to be displayed (blue box)
Hi,
I guess with nominal values that these are coming from smart baselines or are these calculated by the driver?
We usually link the nominal parameter in the driver to an alarm property when being calculated from the driver. That alarm property can then be displayed in the alarm console.
There is the current problem that this cannot be done for a smart baseline as it can't be linked to a real parameter yet. New software feature task 152112 has been created for this, which has a current target release set to 10.1.9.0. That will enable us to display the nominal parameter in the EPM KPI windows and also to be able to use it in the alarm properties.
[EDIT]When reading the question again. With nominal values in the title you're probably not referring to the nominal value like being used for a baseline alarm. You want to see the total number of items that represent that percentage (= include the value of another parameter in the alarm console). In that case it will be available in a parameter and that should then be displayed in an alarm property. That can be done with a driver modification.
Yes, indeed, in the driver the link needs to be made.
See this link for more info about the alarm properties that need to be defined in the options: https://help.dataminer.services/development/DataMinerDevelopmentLibrary_Customer/part3MarkupLanguage/MARProtocolParams/Protocol_Params_Param_Alarm.htm#XREF_69927_Options .
In the alarm tag of the parameter “CM Offline Percentage” you’ll need to add an alarm property and link it to the parameter “CM Offline”.
Let’s assume that “CM Total” has pid 1002 and “CM Offline” has pid 1006. The options attribute of the alarm tag of “CM Offline Percentage” parameter could look like this:
options=”propertyNames:Percentage Details;properties:|*CM Offline/Total: *1006*/*1002*”
This will then result in an alarm property “Percentage Details” that will show for the first alarm in the screenshot the content: “CM Offline/Total: 70/81”. As you can see you can fully customize the value of the alarm property by adding hardcoded text and parameter values.
Remarks:
-The alarm properties need to be defined for every monitored parameter where you want to see this alarm property value showing up.
-As soon as a driver has an alarm property defined, it’s going to show up in the context menu of the columns in the alarm console “Add/Remove column->Alarm properties”. Even if such a parameter is not monitored you’ll still see that alarm property showing up as a possible column in the alarm console to be displayed and you won’t know from which driver this is originating. I would advice to choose the alarm property name wise and re-use them over different drivers and enhance the value to make it more clear.
Suppose that you would have one driver monitoring CMs and another driver monitoring STBs. Then it’s better to use a same alarm property name like ” Offline Count” instead of one driver defining “CM Offline” and another driver “STB Offline” as that would create 2 alarm properties. You would then see for the CM alarm the “CM Offline” alarm property column being filled in and next to that the “STB Offline” alarm property empty. For the STB alarm right under that, the “CM Offline” alarm property will be empty and the “STB Offline” alarm property will be filled in. While it can be displayed in one column if the same alarm property name is chosen.
-By default whenever the value of such a linked parameter is adapted it will update the alarm property value and add an item to the alarm history tree, the new alarm will show “properties changed”. The “Value” alarm column will still show the value when it went into alarm. In other words if there is only one alarm threshold defined of “60%” and the row went into alarm at 60%, and there are current 80 offline of a total 100. You’re going to see Value: 60%, with alarm property Offline/Total: 80/100. That could be a bit confusing for the user as the 60% was when the alarm was created and the 80/100 is the current value.
There is however a possibility to change that. Right click on an alarm and choose properties, then click on the cogwheel, that will open the “Update alarms on value changed” where a custom alarm property can be disabled from updating when the values change.
Just to add to the info from Laurens, you can also define alarm properties through the information template. This way you can achieve the same result, without having to update the protocol.
Ive is correct. This is even more handy without a protocol driver modification when it can be modified through an information template as that doesn’t impact all systems that want to deploy this driver. That alarm property doesn’t show up there when they don’t need it. More info on information templates can be found on: https://help.dataminer.services/dataminer/#t=DataMinerUserGuidepart_2protocolsCreating_an_information_template.htm
Hi Laurens, Thanks for your Reply.
In your Edit, you hit the nail! That is exactly what we need. So if I understand correctly, the driver needs to inform the console which parameters are “linked” to display the desired value in the alarm’s property.
I’ve added a screenshot to try to explain it better.