Hi Dojo,
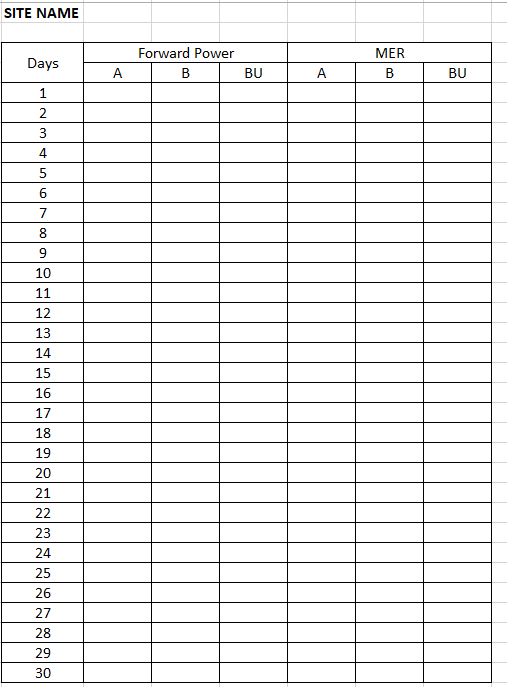
We've come across to create a table for Forward Power one site for 30 days.
Kindly guide how to create the table as per below on Dataminers Dashboard:

Appreciate for you assistance.
Thank You.
Hi Michiel,
Yes the data is store on DMS. We have also enabled trending for this parameter. Could you help us out to achieve this table?
Hi Muhamad,
In order to help you, we will need additional information from your side:
- Is this information coming from an element, and if so, please could you let us know the connector?
- What value you plan to display in the table for each day? The max value in that day, the average value from that day?
Based on this, we can see the options available in Dashboards - GQI that can help you achieve this requirement.
Kind regards,
Hi Miguel,
The data/ information is coming from elements in DMS.
The connectors used are :
1.Rohde Schwarz THU9 – Transmitter, Version Production: 1.1.0.11 for Forward power value
2.Enensys EdgeProbe Advance, Version Production 1.0.2.10 for MER value
I want to display forward power and MER average value per day for a month.
Appreciate your assistance to show us the steps to do in Dashboard-GQI to achieve this requested table.
Thank you.
Hi Muhamad,
The approach to show it in a dashboard would depend on the source of this data. Is this data already stored by e.g. an element on your DMS?