Skip to content
DataMiner DoJo

More results...

Generic selectors
Exact matches only
Search in title
Search in content
Post Type Selectors
Search in posts
Search in pages
Search in posts
Search in pages
Log in
Menu
  • Updates & Insights
  • Questions
  • Learning
    • E-learning Courses
    • Empower Replay: Limited Edition
    • Tutorials
    • Open Classroom Training
    • Certification
      • DataMiner Fundamentals
      • DataMiner Configurator
      • DataMiner Automation
      • Scripts & Connectors Developer: HTTP Basics
      • Scripts & Connectors Developer: SNMP Basics
      • Visual Overview – Level 1
      • Verify a certificate
    • Video Library
    • Books We Like
    • >> Go to DataMiner Docs
  • Expert Center
    • Solutions & Use Cases
      • Solutions
      • Use Case Library
    • Markets & Industries
      • Media production
      • Government & defense
      • Content distribution
      • Service providers
      • Partners
      • OSS/BSS
    • Agile
      • Agile Webspace
      • Everything Agile
        • The Agile Manifesto
        • Best Practices
        • Retro Recipes
      • Methodologies
        • The Scrum Framework
        • Kanban
        • Extreme Programming
      • Roles
        • The Product Owner
        • The Agile Coach
        • The Quality & UX Coach (QX)
    • DataMiner DevOps Professional Program
      • About the DevOps Program
      • DataMiner DevOps Support
  • Downloads
  • More
    • DataMiner Releases & Updates
    • Feature Suggestions
    • Climb the leaderboard!
    • Swag Shop
    • Contact
    • Global Feedback Survey
  • PARTNERS
    • All Partners
    • Technology Partners
    • Strategic Partner Program
    • Deal Registration
  • >> Go to dataminer.services

Display data only in the first row of a table

Solved1.08K views18th July 2024dynamic table time time filter Visio
1
Amber Rowe [DevOps Advocate]435 5th February 2024 2 Comments

Hello!

My goal is to display information from the top row of a table and put it in a diagram. This top row changes every 3 hours. The table shows historic weather forecasts. And I would like to put the information from the most recent forecast into my diagram.

Currently, my diagram has a scroll bar and when used you can see all the data from all the rows in the table. Which I just want one row that correlates to the most recent Time Stamp.

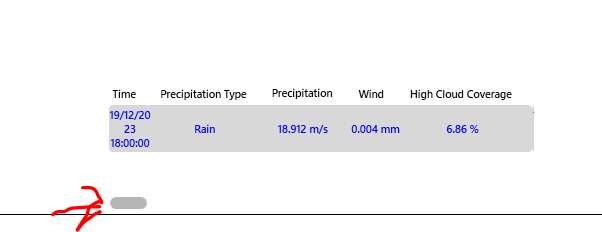
Also, the Time is wrong – it’s showing information from 19/12/2023 when it should be showing information from 05/02/2024.

This is the table it’s taking the information from:

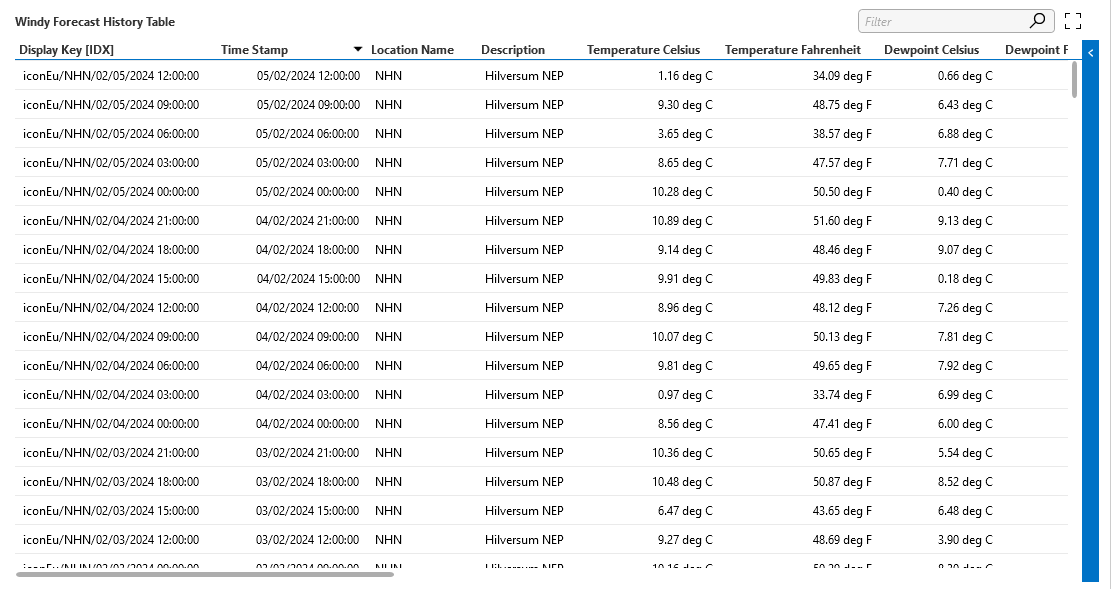
You can also see that the Display Key keeps changing and is never the same.

This is my Visio diagram:

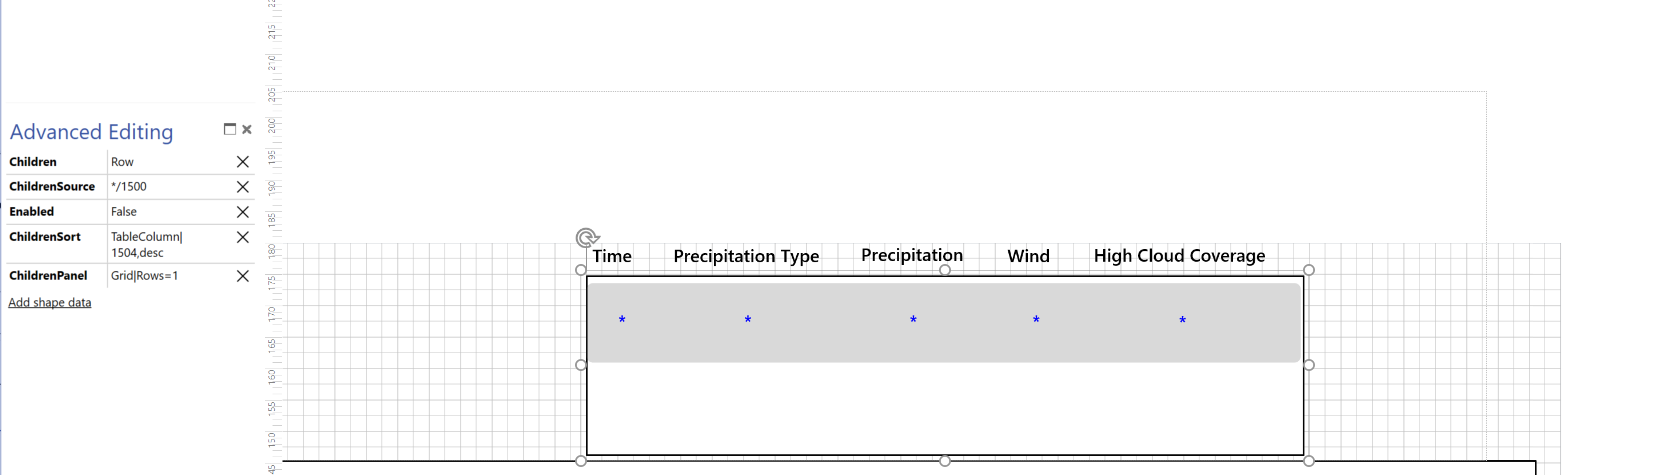
Any help with this would be amazing!

Marieke Goethals [SLC] [DevOps Catalyst] Selected answer as best 18th July 2024
Marieke Goethals [SLC] [DevOps Catalyst] commented 4th June 2024

Hi Amber,
I see that this question has been inactive for some time. Have you found a solution for this yet? If yes, could you select the best answer? Or if not, could you provide some extra info, as Michiel asked below?

Marieke Goethals [SLC] [DevOps Catalyst] commented 18th July 2024

As this question has now been open for a long time and there has been no further reaction from you, I will now close it. If you do wish to investigate this further, could you post a new question?

2 Answers

  • Active
  • Voted
  • Newest
  • Oldest
1
Wale Oguntoyinbo [SLC] [DevOps Advocate]3.39K Posted 6th February 2024 1 Comment

An alternative solution would be using Dashboards and GQI.
This will give you more flexibility in filtering, sorting and selecting Top X in the table.  You could then embed the dashboard in your visual overview.

The GQI query could look like this as an example.

Marieke Goethals [SLC] [DevOps Catalyst] Selected answer as best 18th July 2024
Miguel Obregon [SLC] [DevOps Catalyst] commented 6th February 2024

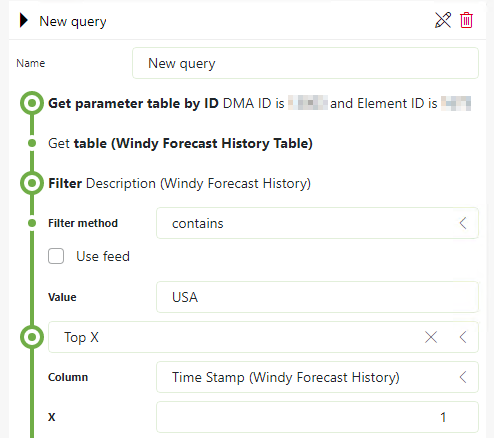
In addition to Wale’s suggestion, you can embed this dashboard in a Visio overview.

0
Michiel Saelen [SLC] [DevOps Enabler]5.63K Posted 6th February 2024 2 Comments

Hi Amber,

I think it would make sense to have the latest values in separate parameters. This way you can just display the parameters instead of having to find the latest row. If this is a Skyline connector, you could ask Skyline to add this to the connector. This is most likely the simplest solution.

Michiel Saelen [SLC] [DevOps Enabler] Posted new comment 6th February 2024
Amber Rowe [DevOps Advocate] commented 6th February 2024

Hi Michiel,

As the latest parameter always has a different display key. I would be unsure how to do that.

Michiel Saelen [SLC] [DevOps Enabler] commented 6th February 2024

Can you share what connector this is?

Please login to be able to comment or post an answer.

My DevOps rank

DevOps Members get more insights on their profile page.

My user earnings

0 Dojo credits

Spend your credits in our swag shop.

0 Reputation points

Boost your reputation, climb the leaderboard.

Promo banner DataMiner DevOps Professiona Program
DataMiner Integration Studio (DIS)
Empower Katas
Privacy Policy • Terms & Conditions • Contact

© 2025 Skyline Communications. All rights reserved.

DOJO Q&A widget

Can't find what you need?

? Explore the Q&A DataMiner Docs