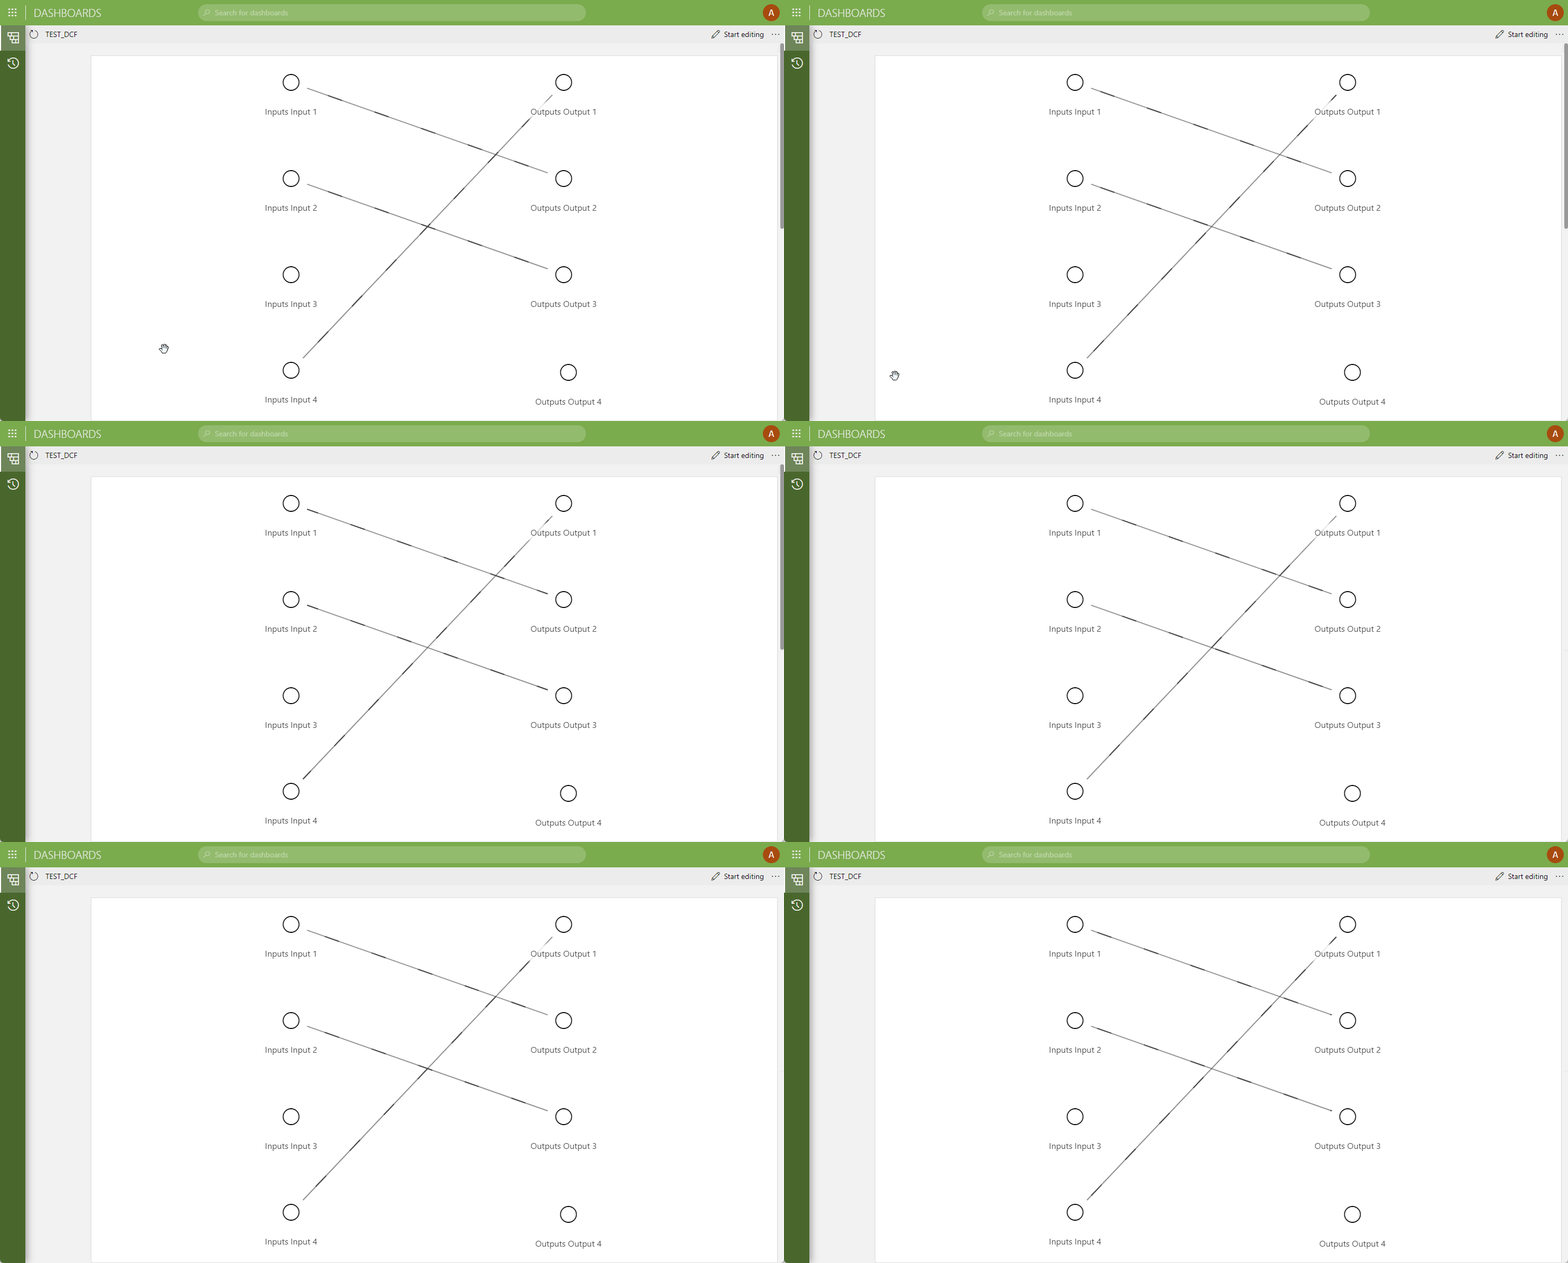
Is it possible to use the Node edge component in dashboards to visualize the connections in a Matrix and If so how would one go about doing this ?
Hi Wale,
I made a quick test and it is possible to use the node edge component to represent a matrix, however keep in mind that you will need to perform some manual actions in the node-edge component so the sources/destinations can be displayed ‘correctly’ (i.e nodes should be organized in a way that a user can distinguish sources from destinations)
To be able to use node-edge, you could perform the following actions:
- Connector (Matrix):
- Enable DCF for the sources/destinations. This will allow you to use the data source ‘DCF Interfaces’ in your query. In this case the DCF interfaces exposed will be used to have internal connections
- The connector should be able to create/update the DCF connections based on the connections on the matrix
- Dashboard
- Create a query for the edges: This query will be contain an inner join of the DCF interfaces and DCF connections available in the matrix element
- Create a query for the nodes: This query will contain the DCF interfaces for the matrix element
- Use these two queries for the node-edge component. You will need to manually position the nodes to make a distinction between sources and destinations
This should look like as follows in node-edge:

Another way to represent a matrix in a dashboard could be through a router panel. I believe it is also a good idea to check also this option:
I don’t believe you can plug a matrix into the node edge and visualize it like you do in Cube. However, given the nature of Node Edge where anything with nodes and edges can be visualized, I’d say you can use the tables behind the matrix and make the cross-points become the nodes in question. See https://docs.dataminer.services/user-guide/Advanced_Modules/Dashboards_app/Available_visualizations/Other/Node_edge_graph.html