Hello All,
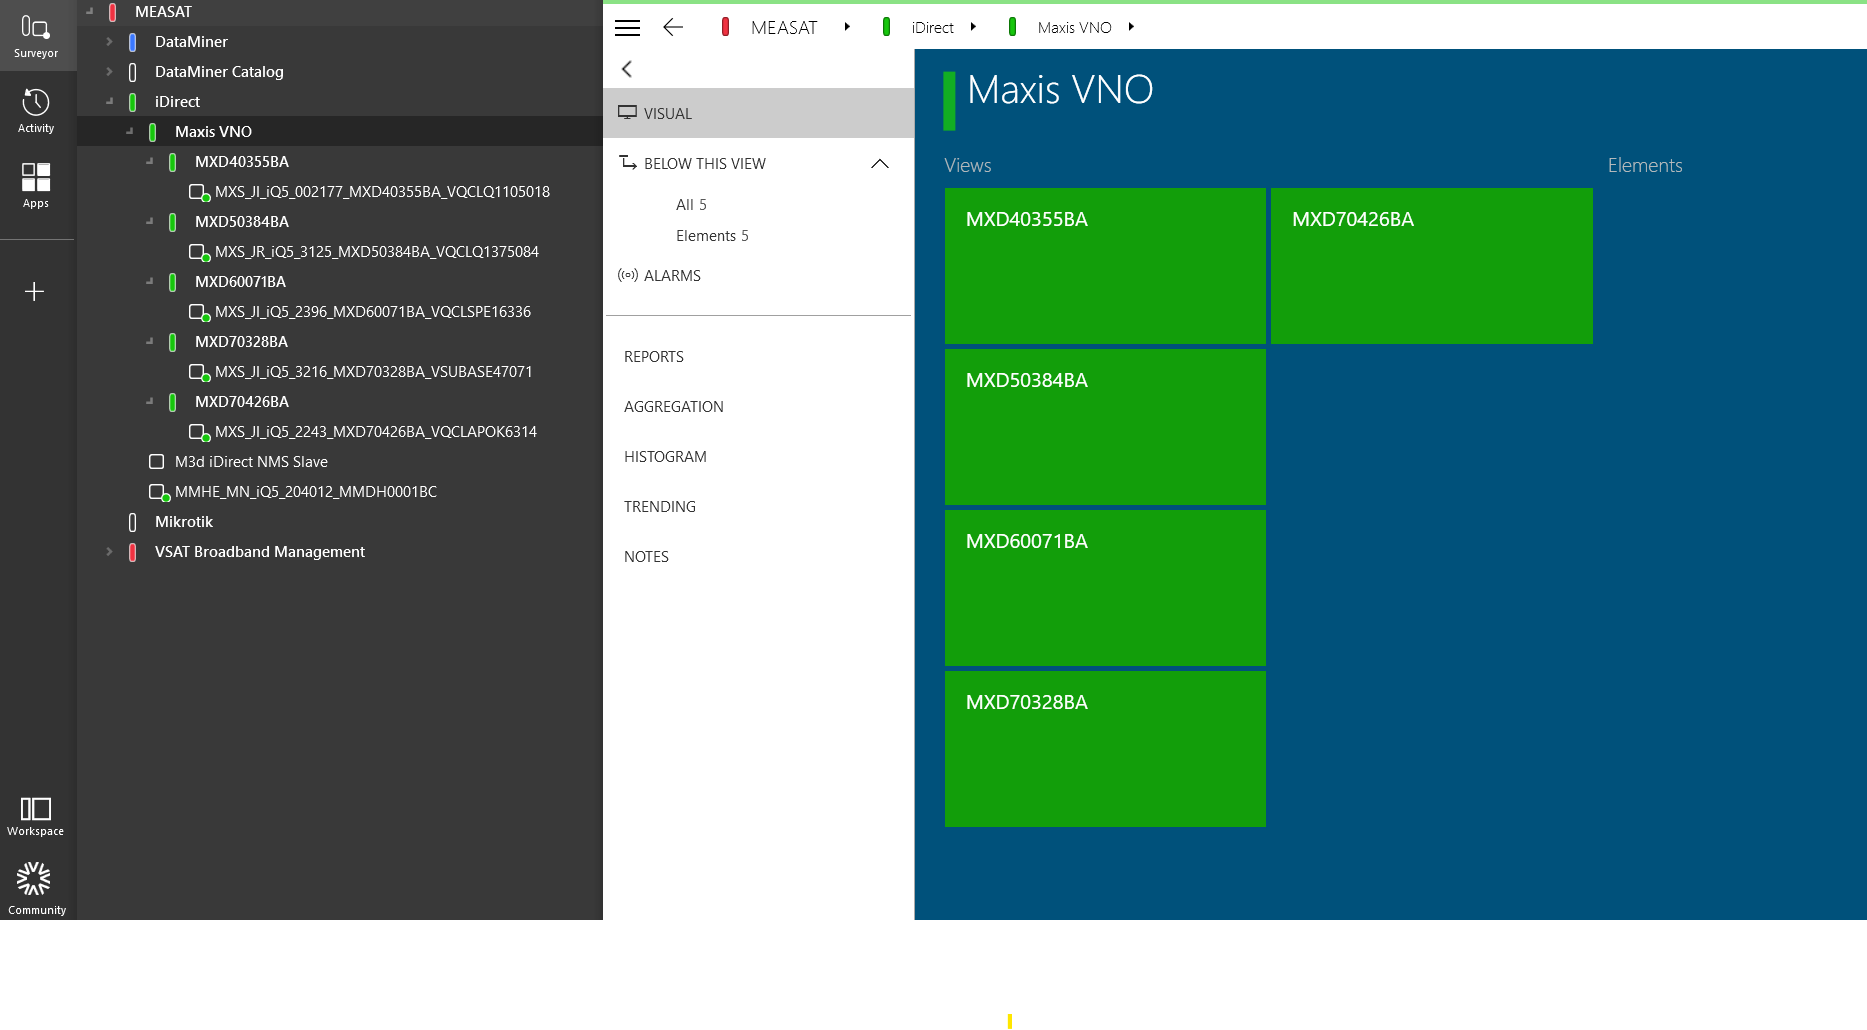
I would like to query regarding Dataminer Cube view and dashboard. Currently, we are monitoring our iDirect remote sites in Dataminer - example as per snapshot (five remote sites under Maxis VNO series)
I would like to get your input and idea on what is the ideal way in monitoring the VSAT performances of these sites? Is it using Dataminer Cube View via Microsoft Visio or using the Dashboard?
If it is via the Dashboard, appreciate your advise on how I can extract the data for example the remote SNR, Tx Power, Up C/No from this Dataminer Cube to the dashboard?
I would appreciate if you could share me your expertise and experience in regards to this. Thank you so much all! 🙂
As this question has now been inactive for a very long time, I will close it. If you still want more information about this, could you post a new question?
Hi Syarah,
I think it will depend on what functionalities you expect to be available, both options are great and they both have their pros and cons.
Let me list some points of attention regarding the Visio or Dashboard options:
- Visio allows you to create very complex topologies and overviews, your imagination is the only limit here, but it comes with a learning curve and we have seen that complex Visios take time to create and maintain
- Visio allows you to execute actions within DataMiner, this is a big difference with the Dashboards app which focuses on reporting and monitoring
- Dashboards has a lot of standard components to easily create the overview you want
There is also a third option called Low Code Apps. This is a feature that allows you to use the same components that you have available in the Dashboards app, but you can create multiple pages and have the possibility to execute actions.
Note that there might be more things to consider before choosing any of these paths for you integration with DataMiner.
If you want you can already start by taking a quick look at some training modules that we have available for free:
- Visual Overview: Visual Overview - DataMiner Dojo
- Dashboards: DataMiner Dashboards - DataMiner Dojo
- Low code apps: there is no course yet for this feature but we do have documentation and some great tutorials that allow you to get started.
Feel free to let me know if you have more questions.
Dear Baptiste Pattyn,
Many thanks for your suggestion. Truly appreciate! I have try and error on both Dashboard and Dataminer View, seems like both have its advantages.
What I am doing right now is by creating a View on Dataminer Cube using Microsoft Visio. After that, I embedded the Visio View onto the Dashboard.
I can see that the View is present. However, I am having a difficulty in getting my iDirect remote element trending available on the Dashboard.
What I am saying is that, I do enable a SNR trending under Protocol and Template > iDirect Trend. I can see the trend is available when I click the graph symbol next to the SNR reading. To add further, this trending also is available on my View using Microsoft Visio but when I export the view on Dashboard by using View > (desired remote), I can’t seem to see the SNR trending anymore.
Do you have any idea on how I can make the SNR trending visible in Dashboard monitoring as well?
I would like to attach the snapshot of my dashboard but I can’t seems to attached the picture in this “Comment” section. Perhaps if you have any idea on how I can explain to you further on this, I would be very happy to extend this issue to you.
Hi Syarah. We were made aware of this open question and wanted to still get back to you. You can feel free to edit your original question so that you can upload screenshots in there.
What kind of shape do you have in your Visual Overview that is not working in mobile? Is it an embedded trend graph or rather a parameter control or parameter shape on which you want to click?
I see that this question has been inactive for some time. Do you still need help with this? If yes, could you take a look at Toon's comment below and answer his questions? Or if not, could you select the answer (using the ✓ icon) to indicate that the question is resolved?