

Hi all,
Is there a way in Dashboards to combine identical parameter tables from various elements of the same protocol and version into one big parameter table?
I am able to combine the data with a GQI query however the resulting table does not display the alarm severity on the parameter and I need that.


Hi Pedro,
I see that this question has been inactive for some time. Do you still need more information for this? If not, could you select Miguel's answer to indicate that the question is resolved?
As this question has now been inactive for a very long time, I will close it. If you still want more information about this, could you post a new question?

Hi Pedro,
I believe what you will need is a couple GQI queries, then a final one to join the element and alarm queries together. Following is what I did using the Microsoft Platform elements on my test system.
Query1 (MS Task Manager) - collects the desired element parameter data and associates with the element name via table join.
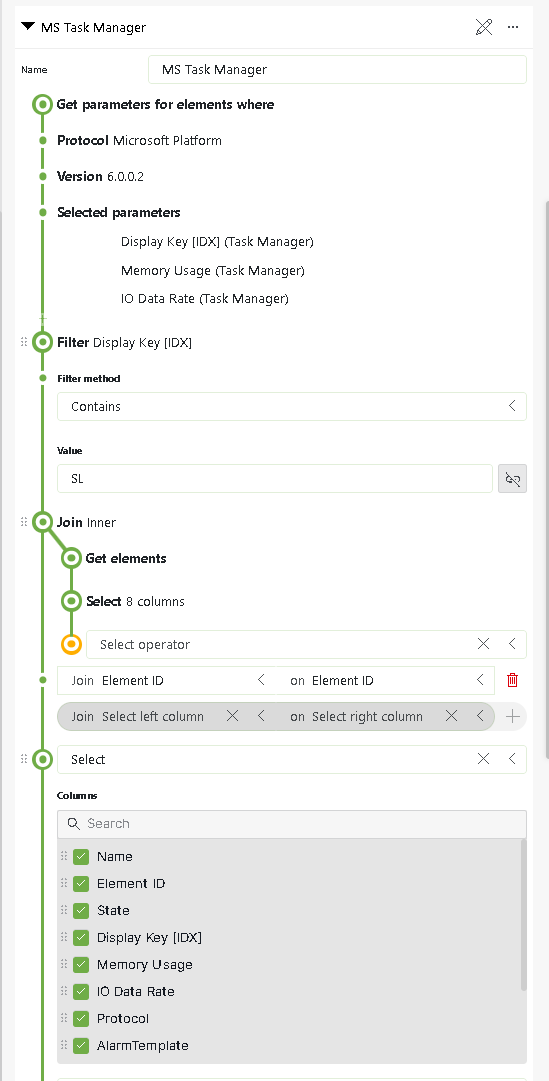
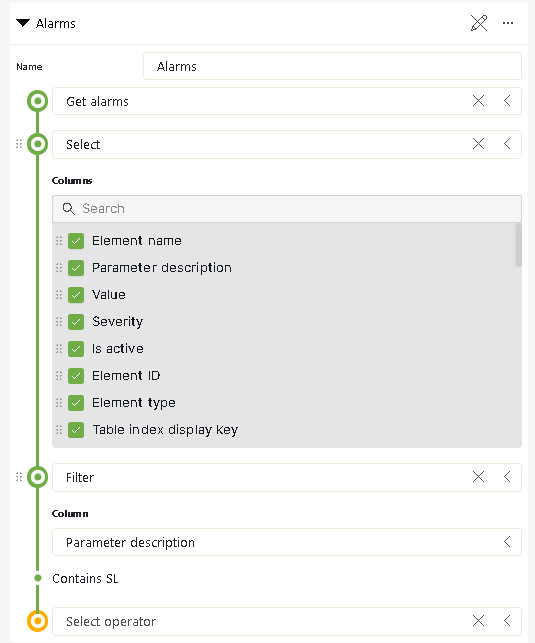
Query 2 (Alarms) - Gets the alarms filtered to the parameter description. You may need additional filtering to get the results are looking for with the Monics.
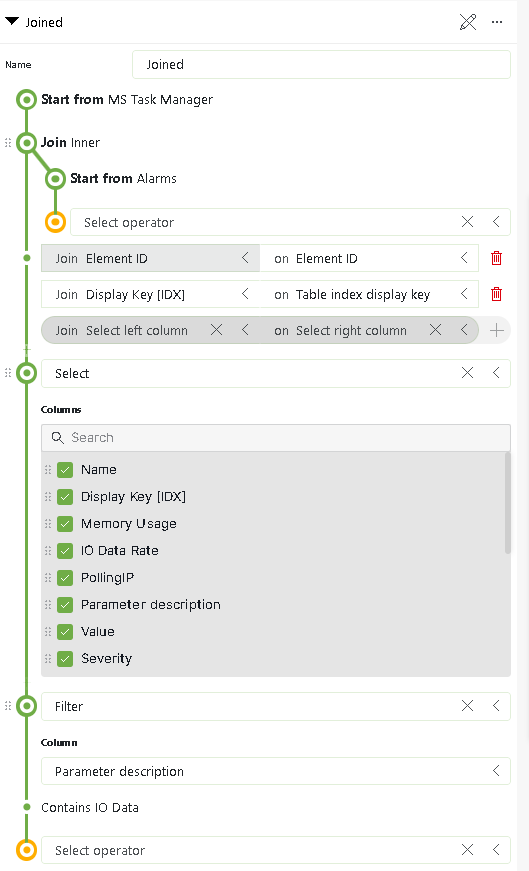
Query 3 (Joined) - This joins the previous two queries together for the final table result we are looking for. I added a final filter at the end 'Contains IO Data' to remove the parameters which I was not interested in. You may need some additional filtering here to get final desired results. Note, in my case I needed two join fields to get the desired results. 'Element ID' to link the elements, then 'Display Key' and 'Table Index Display Key' to link the correct parameters together between the element table and the alarm table. To see the matches, I added each previous query to the dashboard to see step by step results and identified what join fields were needed for the final query.
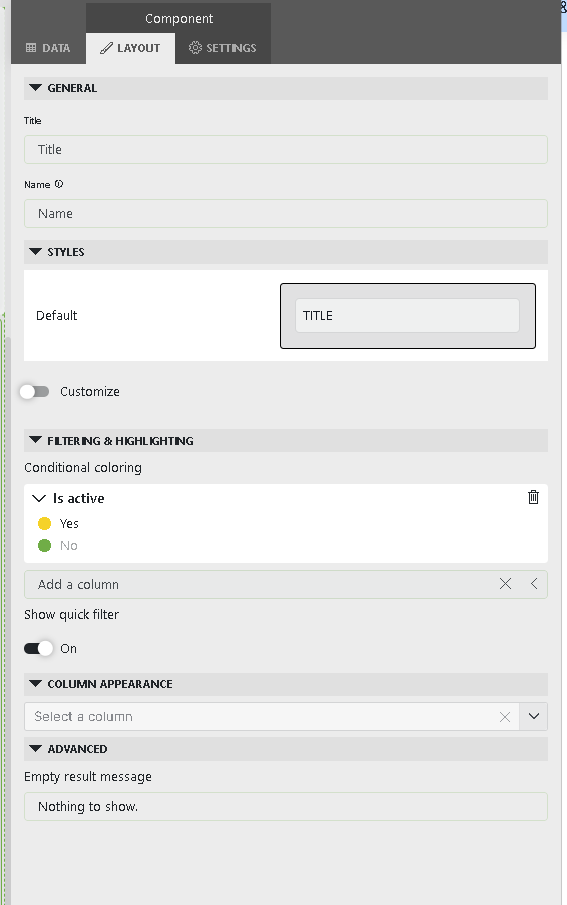
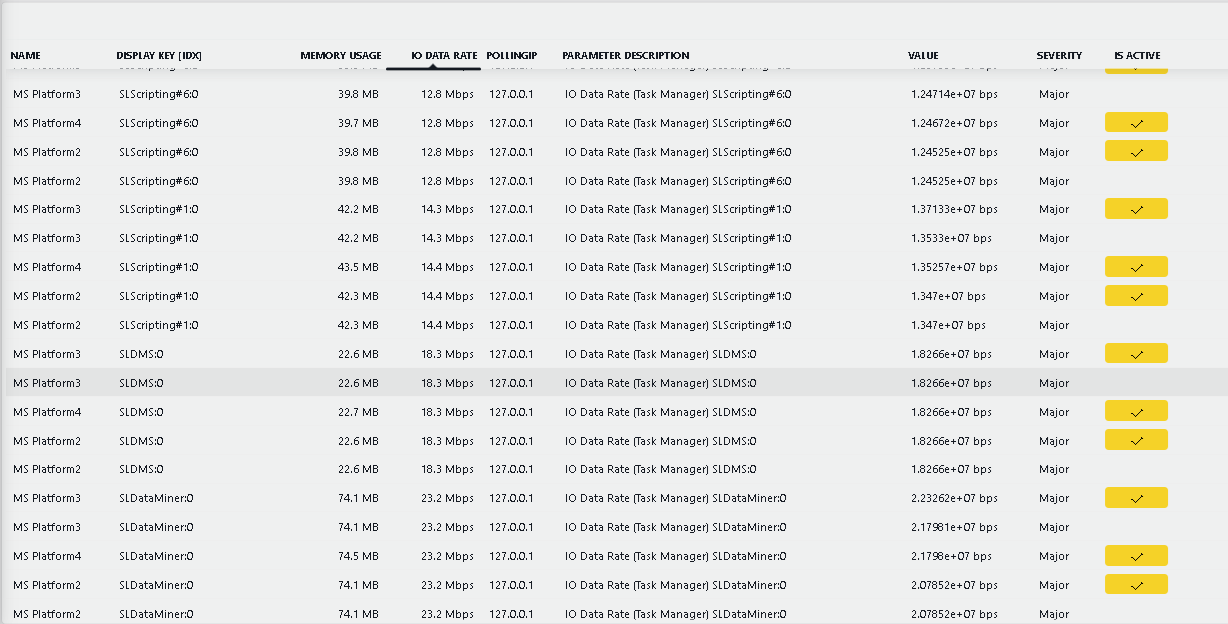
I then placed the 'Joined' Query into the Dashboard and set the Layout to Conditional Coloring for the 'Is Active' Column to highlight the active alarms.
This provided the following table result for all MS Platform Elements with SL in the Display Key Name and current alarm status. The 'is Active' column highlights active alarms. I could have also added conditional coloring to the Severity column but chose not to at this time.
This same format should work for your monics request. Give it a try and let us know.
*** Edit ***
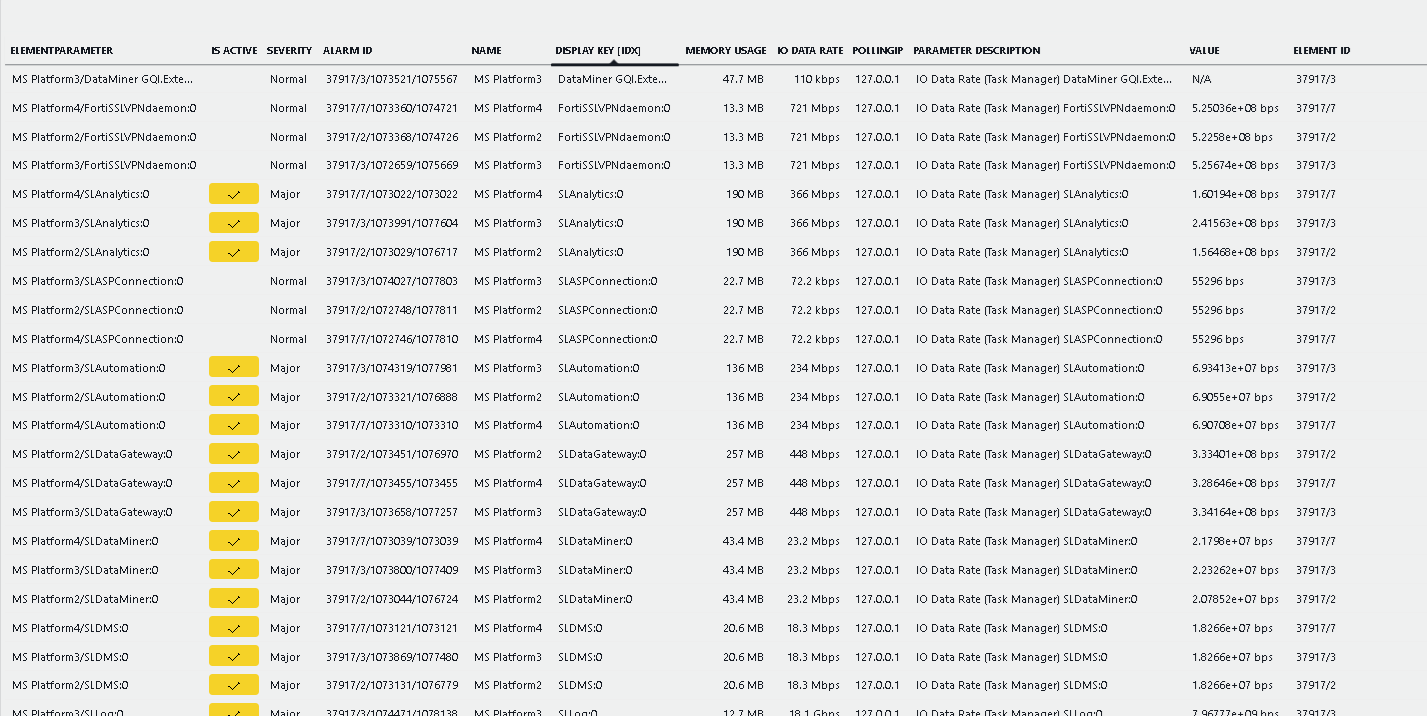
I noticed there were duplicates in the above result so added one more query to get distinct or unique results for the query:
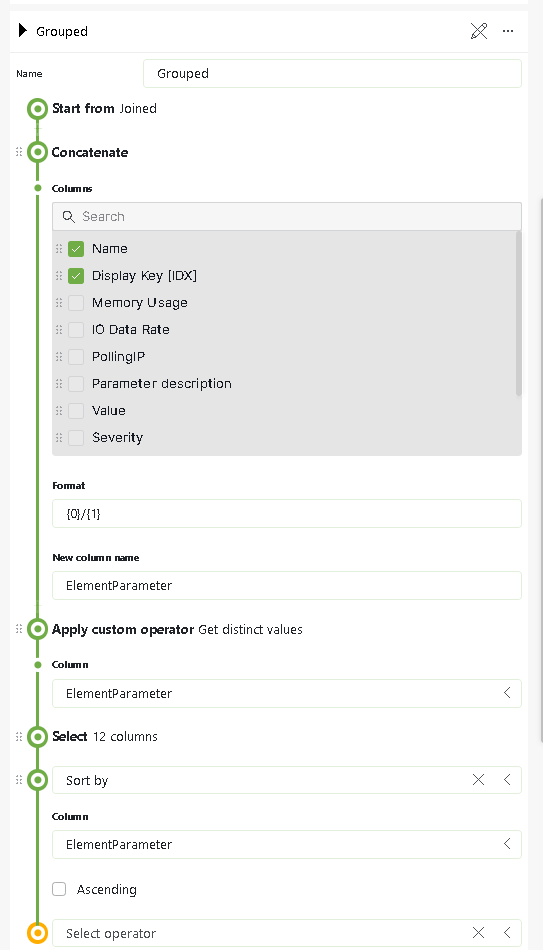
Query 4 (Grouped) - To get the desired results, I concatenated the 'Element Name' and 'Parameter Description' column then applied a custom operator to get the 'distinct values' for this new column 'ElementParameter'. This results in a single entry in the table for each Element/Parameter reading.
Final results - no more duplicate entries showing all alarms, but only the most recent.
Hi Pedro,
Please could you elaborate a bit more about the relationship between displaying multiple parameters from the same protocol and the fact that you are not able to see display the alarm severity? If you let us know the protocol that you are using and the parameters that you would like to combine.
Thanks