Hi Dojo,
How are the average values for a trend calculated from the real-time values?
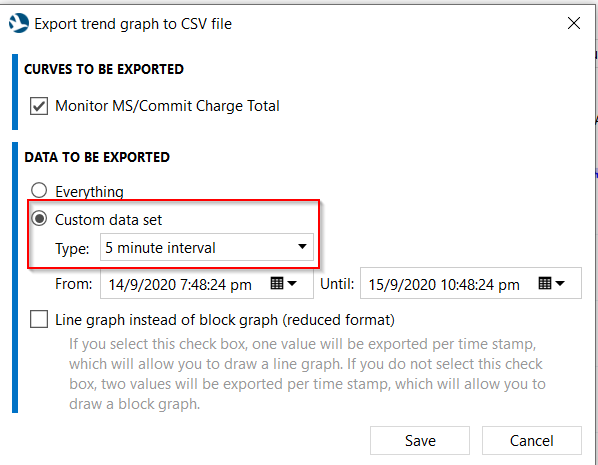
For example, I export the trend as CSV on a 5-minute interval (image below)
Similarly I obtain the real-time data.
If I compare the 5-minute interval CSV file's values with that of the real-time values, I am not able to establish a relationship on how the averages are calculated.
Please can you teach me how the 5-minute interval averages are calculated (preferably with an example), thanks in advance.
I'm only aware of how we do this in DataMiner Cube for client side averaging, but as far as I know it's supposed to function the same way for server side averaging.
For every time slot of 5 minutes (or whatever you have configured) a weighted average is taken of the real-time values. What I mean by weighted might become more clear if I give a fictitious example. Consider the following changes:
- 01:00:00 -> value = 10
- 01:04:00 -> value = 20
- 01:07:00 -> value = 40
Because the value 10 lasted for 4 minutes within the first 5 min time slot and value 20 only lasted 1 minute in that interval (the end of the interval is 01:05:00), the average value of this point in the DB should be:
(10 * 4 + 20 * 1) / 5 = 12
The min value will be 10 for this slot and the max value 20.
Similarly you can make the same exercise for the next 5 minutes, where that should bring you to an average value of 32.