Welcome to the next part of our blog on orchestration and control. In the previous part we discussed the importance of planning the whole event life cycle, from the initial event configuration up to the preparation for a next event.
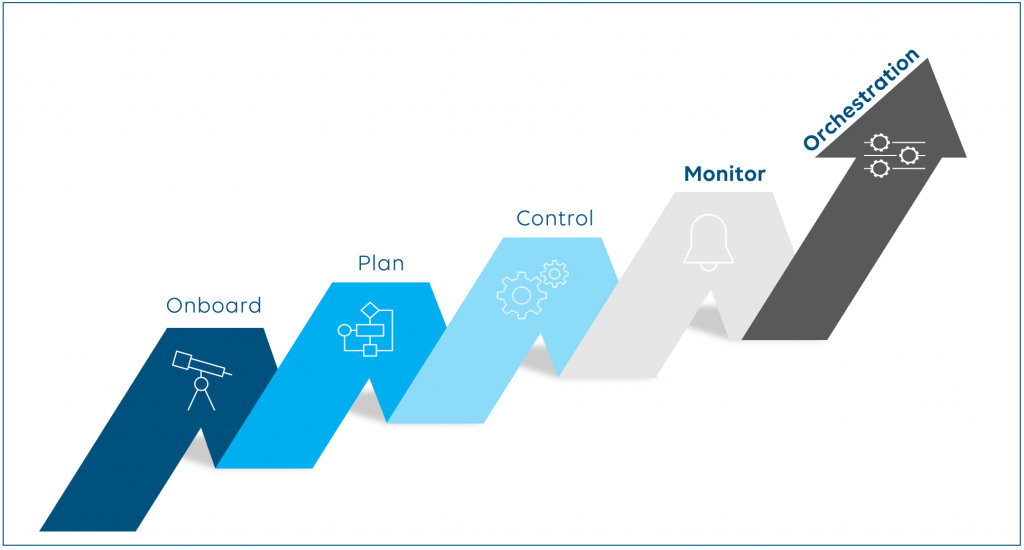
In this post we are looking into step 4: Monitor
What needs to be done?
Monitoring seems to be very straightforward but has many aspects. An orchestration platform not only needs to know which resources are available or already booked, but it also needs to monitor your infrastructure, events and productions. Like the control aspects discussed before, the monitoring capabilities also highly depend on the protocols and APIs supported by your infrastructure.
Let’s discuss a few monitoring basics first.
Reactive or proactive monitoring
For many years, monitoring has been done in a rather reactive way, i.e. static thresholds are set and in case a metric exceeds those preset values, an alarm is triggered. A monitoring solution today needs a much more proactive approach. AI-driven capabilities like anomaly detection and forecasting, just to name two features, are essential for that. To make sure you have ample time to act before there is an impact on your operations, you need a system that tells you things are likely to go wrong in the future, e.g. your server will run out of memory in a few hours because of a memory leak, before things actually go wrong.
Real-time monitoring
You might have come across the discussion that monitoring must be done in real time under all circumstances. Any change on any parameter or metric must be reflected in the monitoring platform with no delay. Well, we think it depends: while it makes perfect sense to get notified of a network interface changing its state from “UP” to “DOWN” immediately, it is not that useful for metrics that constantly change, such as the actual bandwidth on that interface. If you were polling your switch every few milliseconds or even more often for the actual bandwidth, you could easily overload the device. And even if the device supports subscription-based protocols (e.g. OpenConfig), where the device actively notifies monitoring systems after every change, that could cause a big impact on the device CPU utilization for a metric that is constantly changing. Polling such ever-changing parameters every few seconds might be the better option. And think about other parameters that almost never change during daily operation, such as the firmware of a device: you probably only want to poll that value after a device restart.
What to monitor
For full visibility, you need to monitor both your infrastructure and your content. For the latter you will need to integrate devices that can decode your audio and video content. This can for example be a transport stream probe, a video analyzer, a multiviewer or a QC engine for file analysis. And for your software applications, make sure to monitor all infrastructure layers, which is also called north-south monitoring:
- Facility (air conditioning, temperature probes, water leaking probes, wind sensors, etc.)
- Core infrastructure (servers, network, storage, etc.)
- Operating systems, virtual machines, microservices, etc.
- Media applications (hardware, software, on-premises, off-premises)
24/7 monitoring & service-aware monitoring
Now let’s see why monitoring and orchestration can no longer be handled independently of each other. In the past, monitoring was mainly about 24/7 static monitoring. The latter is still a good fit for those devices and resources that have no dependencies on any event or production. For example, this can be your PTP and master clock reference generator.
With service-aware monitoring, the monitoring of your resources follows the life cycle of your events dynamically. The conditions determining which parameters you want to monitor and which thresholds are important need to adapt to your service. A video server that is not used as part of an event will not play out any clip, so no alarm should be created when the server has no clip loaded and the network interface reports a 0 Mbps output. But once the video server is in use, you want to monitor if there is a clip playing, in line with what has been scheduled on your traffic system. You not only need to monitor that this server is actually playing, but also that the right format is used. It can cause a big problem when your video server accidentally creates a 10 Gbps UHD output instead of an HD stream with 1.5 Gbps only.
Also, in the event something does go wrong, you want your monitoring system to be able to tell you exactly what the impact will be. Your monitoring system thus needs to have exact topology and service information: which underlying hardware and processes support which top-level services? Which services are affected if this one server goes down? Which processes have priority to be restarted on a spare server? When things get heated, you need to have all this information instantly, so you don’t have to go manually diagnose all of this before you can take action. This is why you need monitoring at the service level as well as at the element level.
Why do you need this?
- 24/7 real-time monitoring is essential to get a 360° overview of your complete infrastructure and content end to end.
- Resources can only be managed dynamically when you can be assured that the resource you want to use for an upcoming production is in an healthy state.
- Service-aware monitoring adapts your monitoring and alarm templates to your event life cycle and associated settings and avoids false alarms.
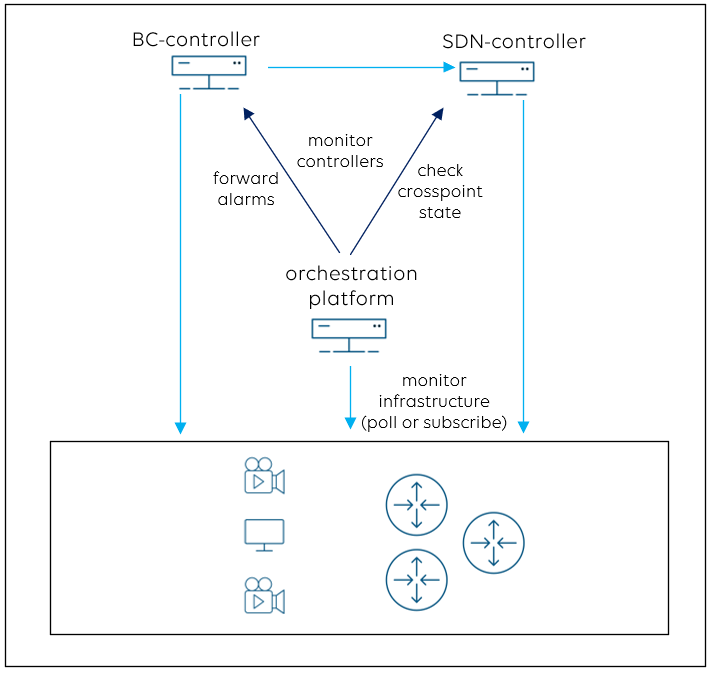
How to integrate with SDN- and BC-controllers?
Like any other device, your SDN- and broadcast-controller also needs to be monitored, starting from the controller hardware up to the application layer.
360° monitoring also includes your media flows. The orchestration platform can compare the “crosspoints” (i.e. the flows) that have been set by the SDN-controller with the real situation in the network. Let’s assume you connect a source with a destination via the BC-controller’s routing panel. If the SDN-controller executes the command but your monitor stays black after you hit the TAKE button, then something went wrong in the chain. Media flow tracking will allow you to identify the root cause of a problem, for example a missing multicast route in one of your switches. It is equally important to also detect “ghost flows”, i.e. flows that are present in the network but have not been set by the SDN-controller.
When it comes to the integration with the broadcast-controller, it is possible to forward critical device or event alarms that have an impact on your operation to the broadcast-controller, so that operators get notified via the BC-controller user interface as well.
In the next and last part of this blog, we will have a look at DataMiner and give an overview of the operational areas in the broadcast world for which DataMiner can take the roles of orchestrator, broadcast-controller and SDN-controller, all together in a single platform, and where it’s probably more efficient to interface with a third-party controller.