Hi Dojo,
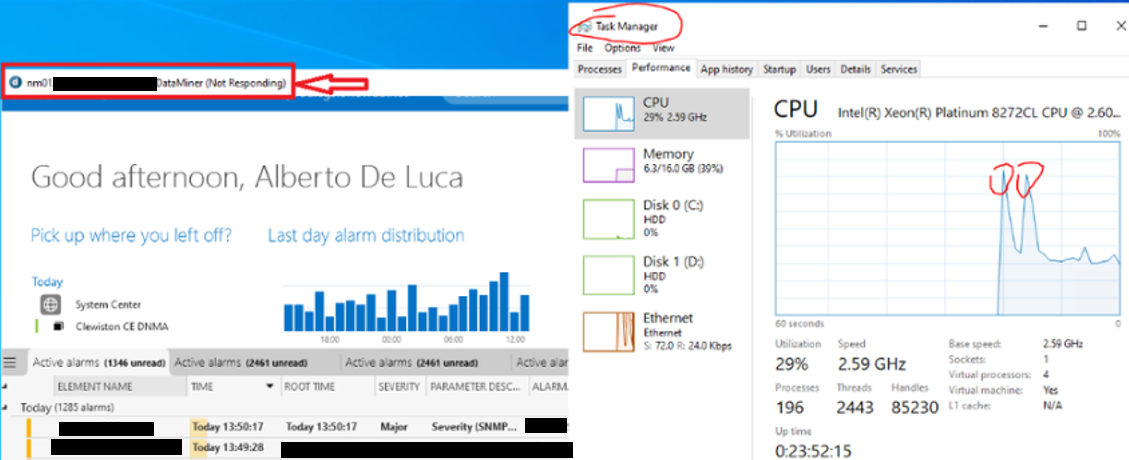
I’m troubleshooting an enterprise-scale installation of CUBE on Azure VMs – from the ongoing analysis, it seems that whenever a CPU spike is present on the VM, then DataMiner CUBE
becomes unresponsive:
the client gets stuck and a “Not Responding” message is displayed on the GUI of the desktop app

At times, it gets back nominal after 3 to 15 min, at times the app can crash, other times we just restart the APP to quickly regain control.
I’d like to determine if these CPU spikes on the VM are creating the “not responding” effect,
or if it is the other way around, with CUBE using 100% of one or more CPU cores for a long time, thus producing the spikes observed via Task-Manager.
My colleagues & I have come across this page:
https://docs.dataminer.services/user-guide/Troubleshooting/Procedures/Collecting_DataMiner_Cube_memory_dumps.html
Please, what’s the recommended type of dump to troubleshoot CPU performance issues?
Any specific settings to use?
In the past, we had an old DCP task: 181807 – I understand that a fix was applied in DM 10.2.7 to address CUBE performance when many cores are defined in the VM – we’re now running DM 10.2.10.0, so I’ve assumed the fix is embedded, but wondering if this could be still related – any steer will be helpful.
Keen to understand if it is also recommended to run CUBE from a physical client to achieve better performance.
If there are any guidelines in terms of how a VM should be defined to better match what’s required for CUBE, that would also help.
Thanks
Hi Alberto,
When Cube gets stuck with “application not responding”, it can be caused by either a blocking call or deadlock (resulting in 0% CPU usage of the main thread), or by intensive processing (resulting in 100% CPU usage of the main thread). In both cases taking a few consecutive memory dumps (e.g. 3 dumps each 10s apart) with procdump -ma DataMinerCube.exe can be a good start for us to diagnose the root cause. If Cube recovers from the unresponsiveness, there may also be a stacktrace in the Cube logging (“freeze detection”) that will point us in the right direction.
Another tool we use internally is JetBrains dotTrace, and using the command-line version to record a trace of Cube activity can be a next diagnostic step in the case of 100% CPU usage. You can get in touch with our team to assist with this.
I have no experience with Azure VMs, but a general rule with virtualization is that you do not always have a clear view on the overbooking of resources from within the VM, and activity in another VM on the same hardware may affect what a VM is capable of. Just like for servers, it may be interesting to run a benchmark tool like PassMark to gauge the real-world performance of the VM.
Thanks for the prompt feedback, Bert
Will capture a few dumps of the type suggested and then get in touch with the support team