Hi Dojo Community,
Working with dashboards, I found that in our lab environment there are some parameters that are getting negative values on their average even when is not possible for the parameter to have negative values.
Here is the pivot table that is displaying the negative values:  As you can see, the min value is displaying 0 but the average is showing negative values still.
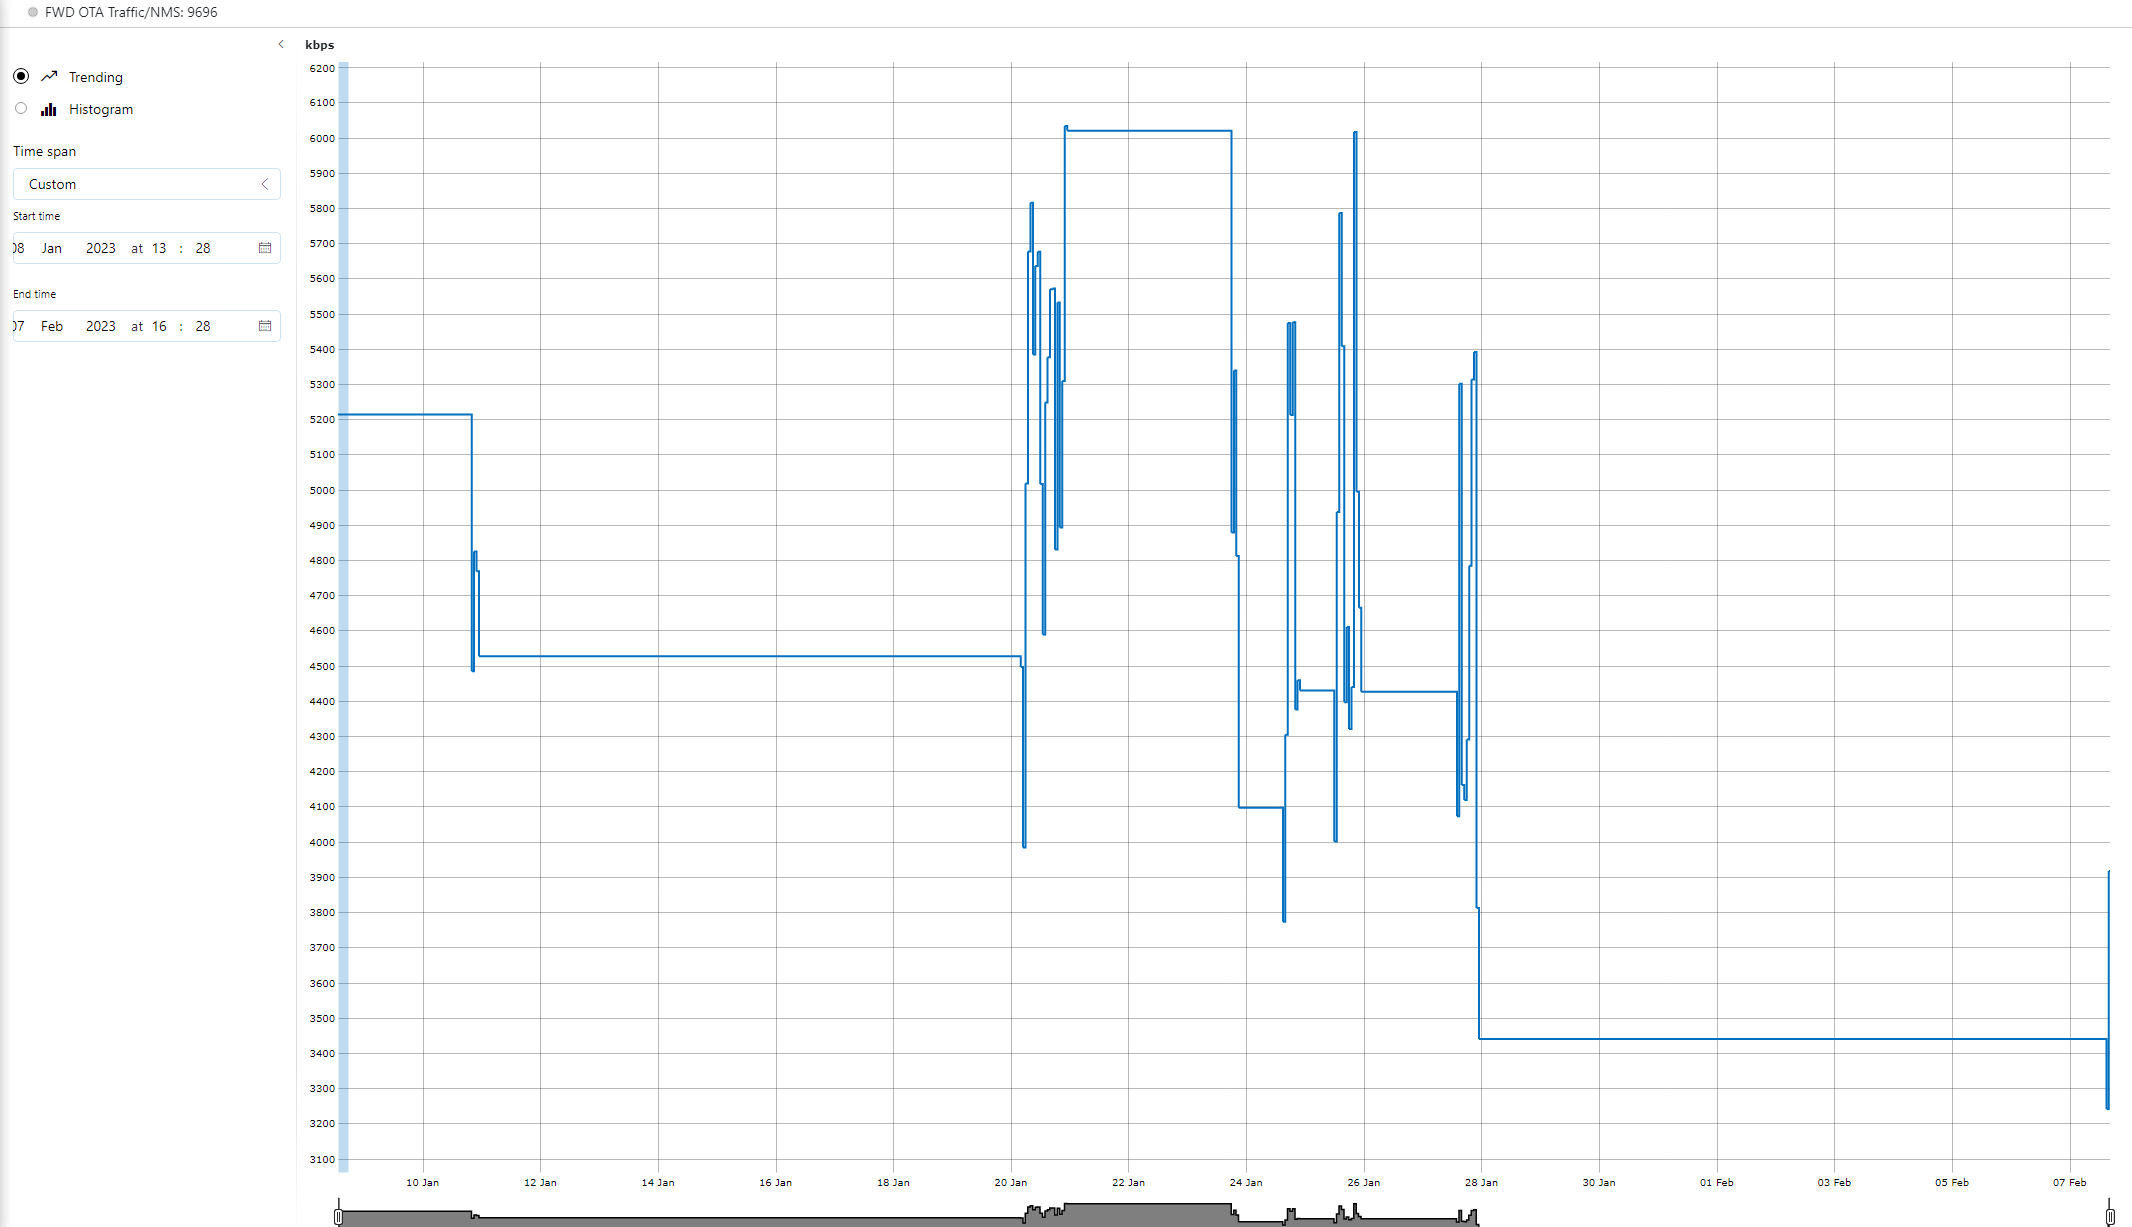
And here is the trend data for that same timespan:

There is not any negative value on the trend for that time.
Thanks to Sebastiaan suggestion I tried replicating the GetHistogramTrendDataMessage and the response was the same as is displaying on the dashboard:
{
“TrendStatistics”: {
“53804/9696”: {
“Minimum”: 0,
“Maximum”: 7063.1265,
“Average”: -11191.259396899211,
“MeanDeviation”: 126.16295152192977,
“StandardDeviation”: 15952.751666052229,
“SecondStandardDeviation”: 31905.503332104458,
“ThirdStandardDeviation”: 47858.254998156684 }}}
We have the dashboards on another environment, and we don’t have those negative values there. The only difference between the systems is that in the lab environment, the element is constantly being stopped and restarted and it can go days without being started.
Is there any reason why the negative values could happen? And if so, there’s a workaround to avoid those?
Thanks in advance!
Since these values are returned from the message we can rule out any dashboard or web API issue. So we’re probably looking at SLDataGateway next…
Hi Luis, Could you get in touch with the Data Insights Platform Domain and create a task to figure this out further? We’ll need some info to investigate this properly such as a DELT export with trend data. Thanks!
As far as I know the Dashboards app is not calculating these values, instead they’re received from the DMA by using a GetHistogramTrendDataMessage. Can you verify that the result of this message is the same as the values that are displayed in the pivot table? You can use the client test tool to send such a message.