Visual Overviews provide you with a very powerful and graphical way to navigate, monitor, and manage your entire infrastructure. However, designing Visual Overviews can sometimes feel a bit daunting.
With the many tools that both DataMiner and Visio offer, it can feel quite overwhelming to explore all the possibilities for creating Visual Overviews in our user guide. So, to assist you in a more concrete and visual way, we’ve created the “Design Examples” view on our Ziine demo system.
Don’t have access to Ziine yet?
Ziine is our live demo system, which lets you explore the power of DataMiner for free! Get a taste of DataMiner and see for yourself why it’s the leading NMS/OSS solution for the ICT media and broadband industry.
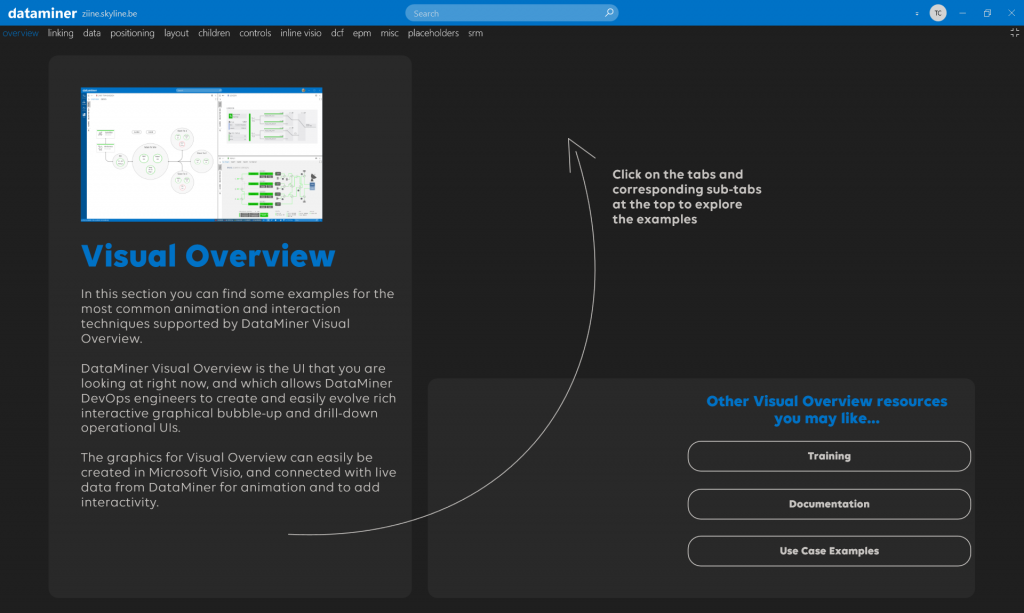
Where can I find the “Design Examples” view?
First of all, you’ll need access to Ziine, our live demo system. If you already have access to Ziine, you can simply launch your DataMiner Cube app. There you can find the “Design Examples” view by navigating to it via the surveyor (Operations > Design Examples) or by using the search bar at the top of your screen.
Every part of the “Design Examples” view was designed to be as simple as possible. This means that each individual Visual Overview feature is clearly defined and demarcated. For more advanced examples and combinations of features, feel free to navigate through the rest of the demo system.
Learning Visual Overview functionality with the “Design Examples” view
“Design Examples” contains as much of the basic Visual Overview functionality as possible. Our user guide also contains references to the specific pages where you can find the examples on a per-feature basis. Both Ziine and the user guide are updated consistently whenever a new version is released. New features are added whenever they are available to you.
Don’t feel like reading what the Ziine setup has to offer, but want to experience it yourself? Just go and connect to Ziine!
For those that aren’t yet convinced that Ziine holds what they need: read on! And hopefully, you’ll find it below. If at any point you notice something is missing, feel free to leave a comment.
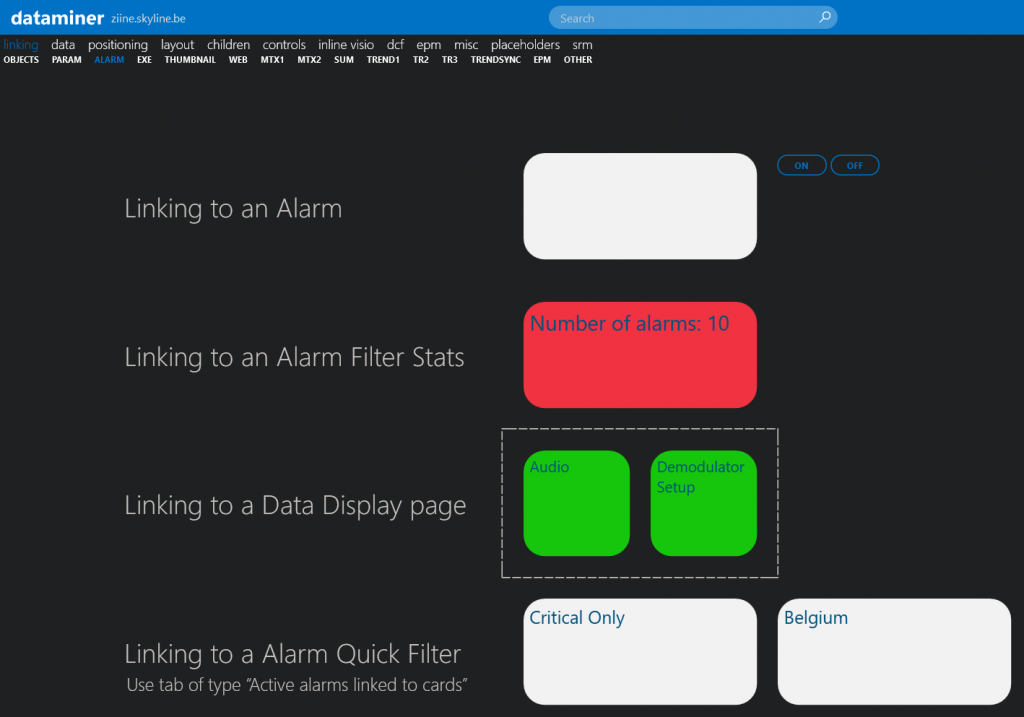
Linking
Contains examples of objects that you can link to with Visual Overview. Including:
- Elements
- Parameters
- Views
- Services
- Redundancy groups
- Alarms
- Automation scripts
- Video thumbnails
- Web pages
- Matrices
- Trend data
- EPM
These pages also contain many examples of advanced functionalities for links, ranging from calculations over conditional manipulations to retrieving historic data.
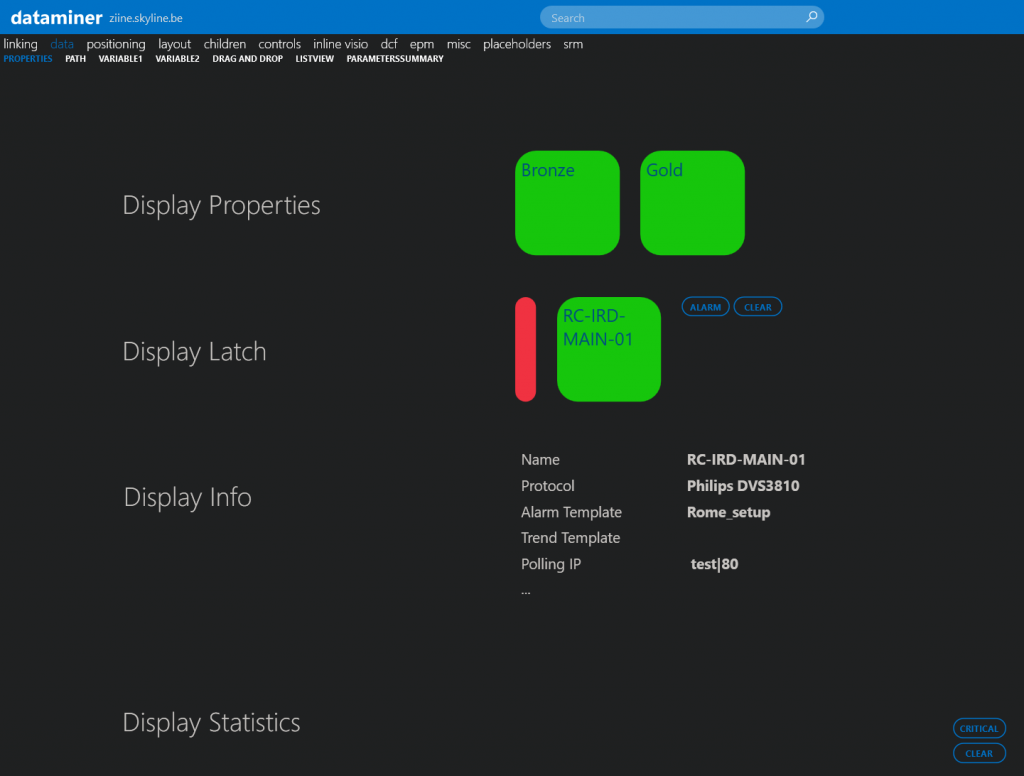
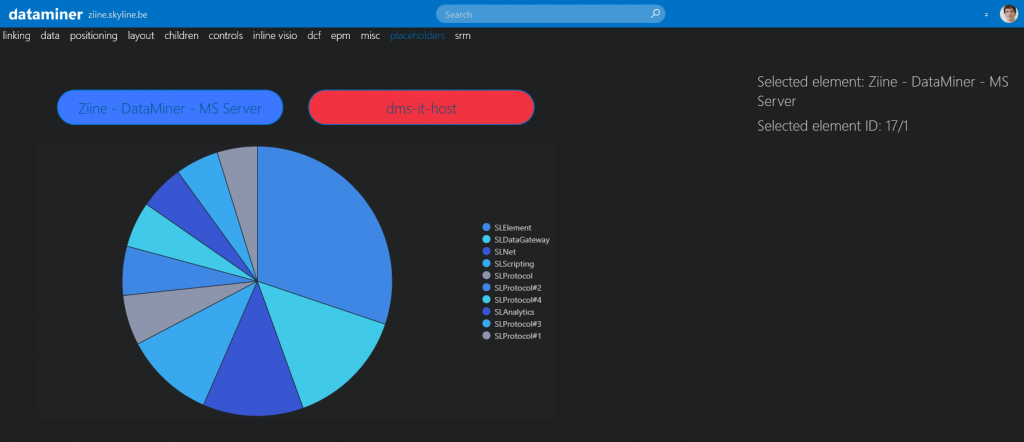
Data
Contains examples of what data you can show in Visual Overview, including:
- Element/View/Service properties
- Latch state
- Element info
- Alarm statistics
- Drawing paths based on data
- Session variables
- Drag and drop
- Lists of DataMiner objects
- Summary of parameter values
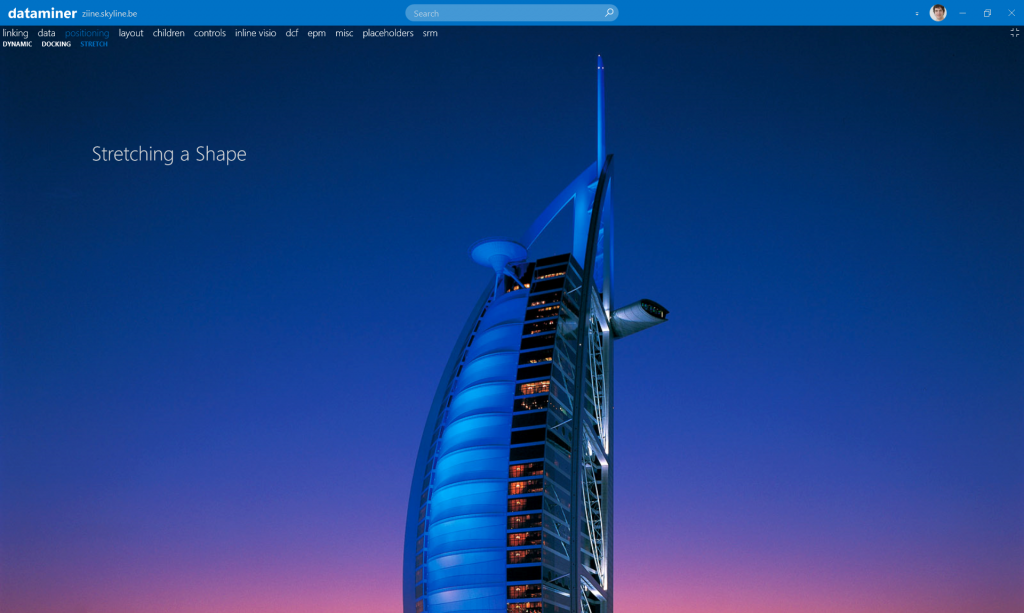
Positioning
Contains different ways to position your Visual Overview components, including:
- Dynamic positioning
- Docking
- Stretching
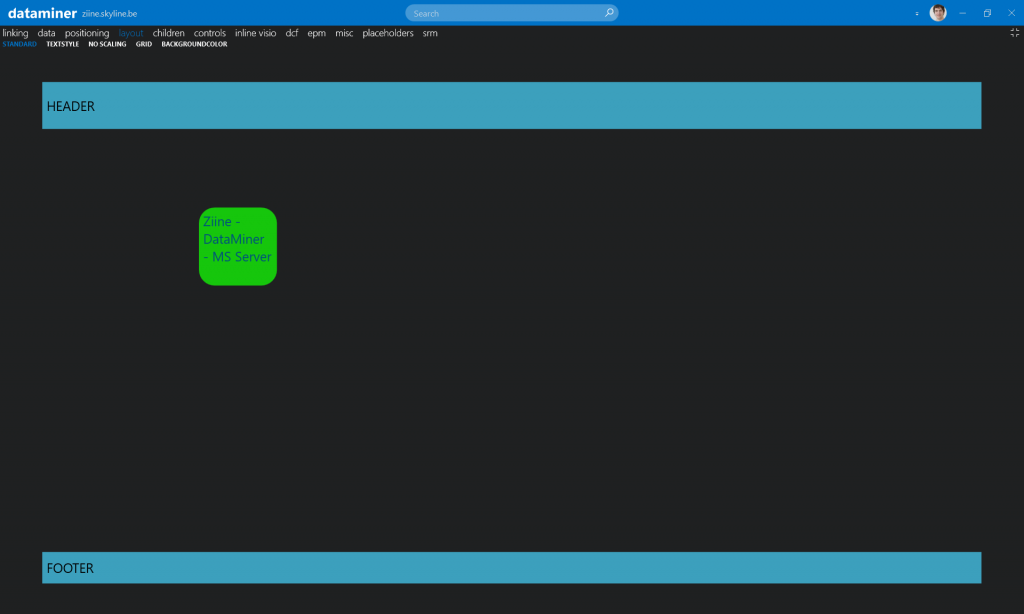
Layout
Contains different layout options for your Visual Overview, including:
- Headers & footers
- Changing the text style
- Disabling scaling
- Grid layout
- Shape background coloring
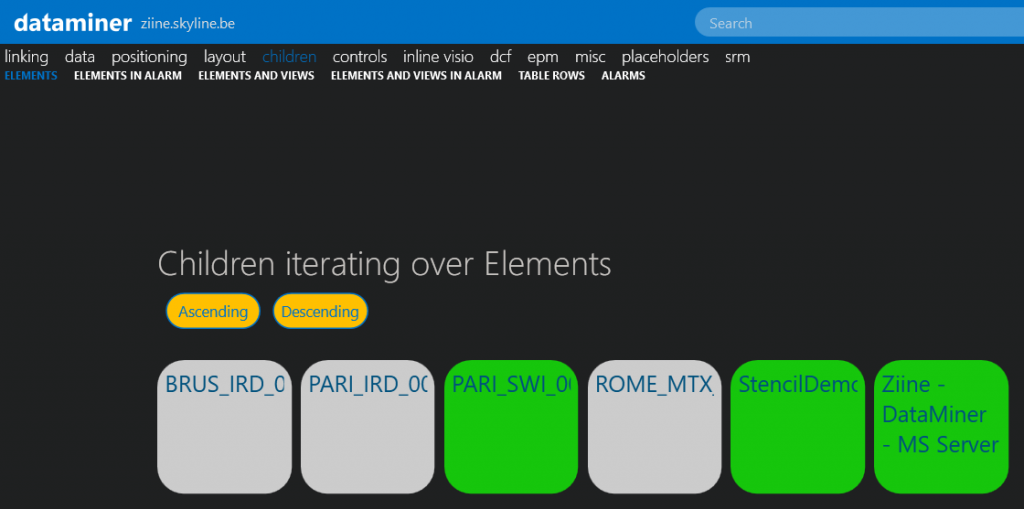
Children
Contains different examples of children shapes. These are panels with template shapes that you can create to automatically list different kinds of children in your DataMiner System, such as:
- Elements (in alarm)
- Views (in alarm)
- Table rows
- Alarms
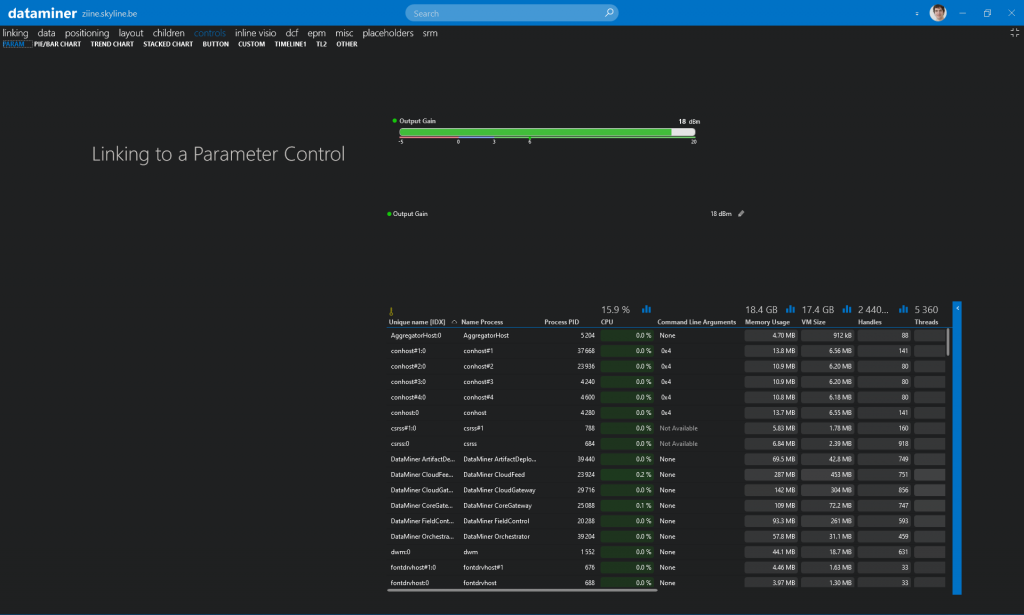
Controls
Contains examples of different types of controls that can be shown in Visual Overview, including:
- Parameter and table controls
- Charts
- Shapes as buttons
- Custom controls
- Alarm timelines
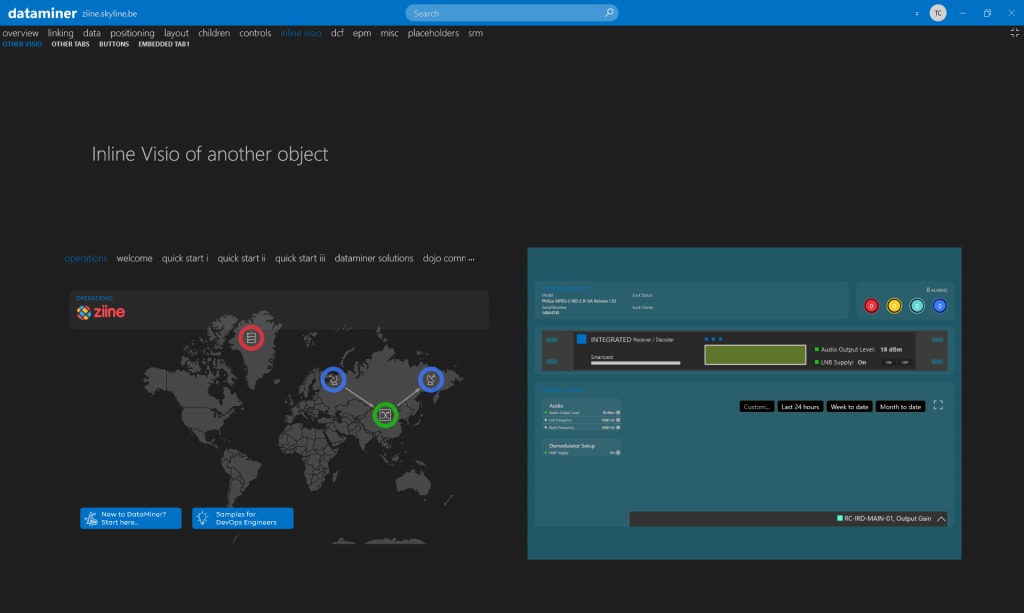
Inline Visio
Contains different ways to embed one Visual Overview or part of it into another, such as:
- Inline visualization of another DataMiner object’s VO.
- Inline tab controls
- Buttons to show a Visual Overview in a separate window, pop-up, tooltip, …
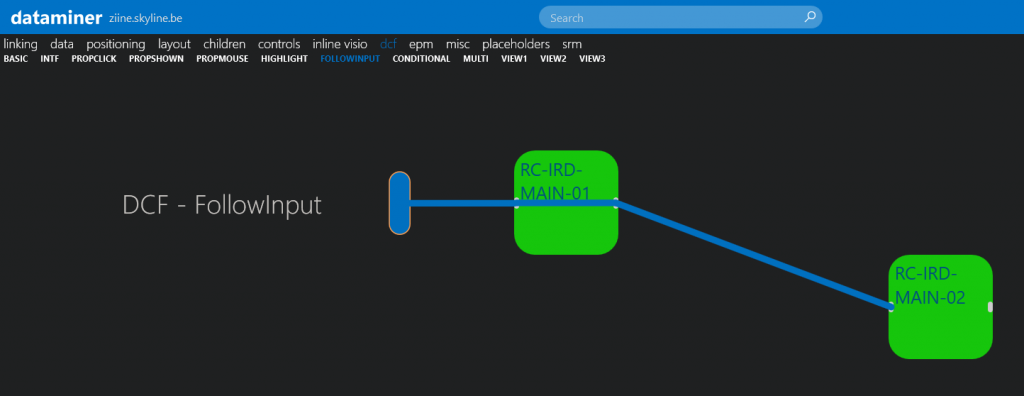
DataMiner Connectivity Framework (DCF)
The DataMiner Connectivity Framework (DCF) shows the connections between devices and their interfaces, both virtual and physical. All of this can be visualized in your Visual Overview. The DCF pages on Ziine contain examples of the following:
- Element and interface connections
- Connection property visualization
- Path highlighting
- View connectivity
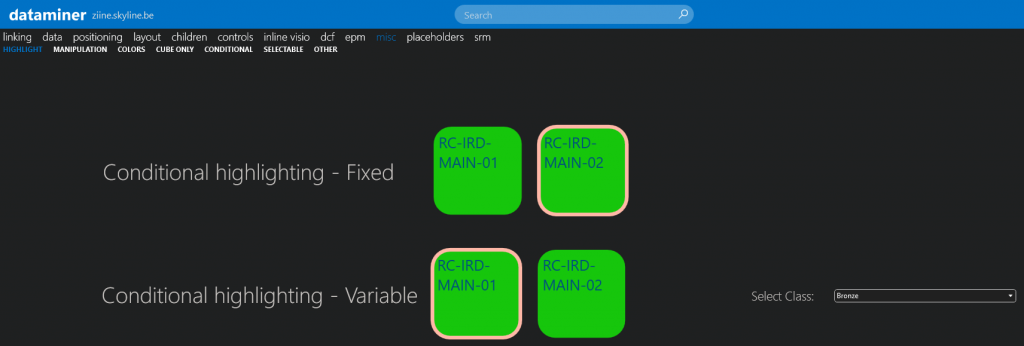
Misc
Includes:
- Conditional shape manipulations
- Background coloring
- Conditional show/hide of pages
- Selectable shapes
- Right-click parameter sets
- Shape options
- Grouping
Placeholders
While the amount of placeholders you can use in Visual Overview is enormous, this section doesn’t contain many examples. Currently, we have one page on “placeholders”, which showcases the element placeholder in combination with the var placeholder.
If there are any examples you’d like to see on the “placeholders” page, just let us know!
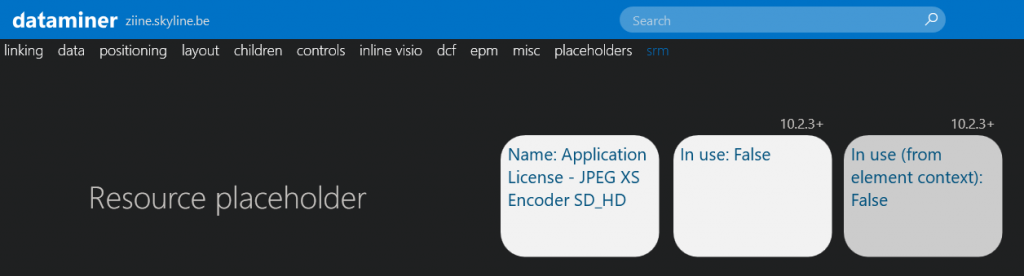
SRM (Service & Resource Management)
Just like the “placeholders” page, this page is in its early days and currently only contains examples of the resource placeholder.
Are there other examples you want to see on the “SRM” page? Let us know! Alternatively, you can check the rest of Ziine as it also contains several SRM examples throughout.