Traditional data polling and trap forwarding
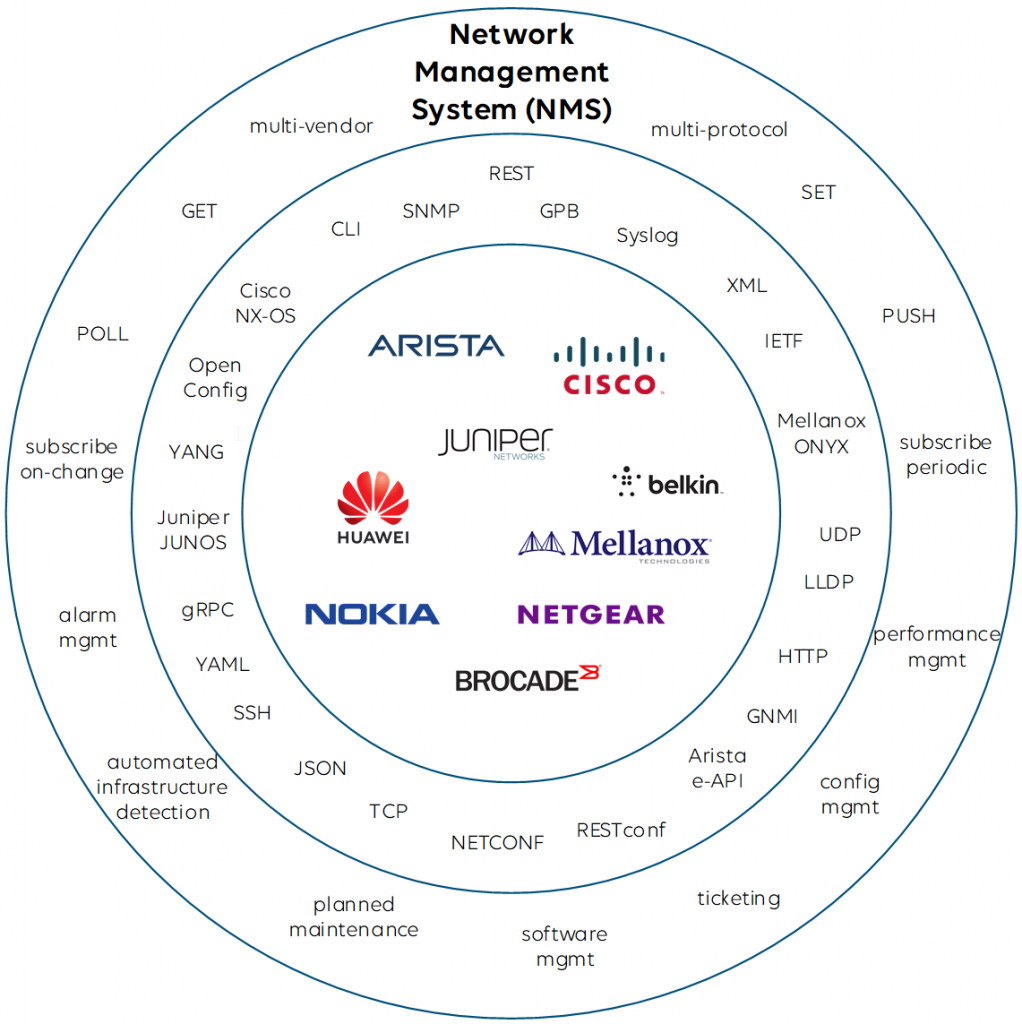
When it comes to network monitoring, network management systems (NMS) can get data from the underlying network infrastructure in many ways. Basically either the NMS can actively poll data from third-party products, or the data can be pushed from the products towards the monitoring system. SNMP, CLI, Syslog, as well as vendor-specific protocols are supported today by network management systems and switch vendors.
To give you a simple example, SNMP allows you to poll metrics, which could be just once or repeated regularly, and SNMP traps can be sent immediately by the managed product to a monitoring system when an event happens at a switch, for instance when a network interface goes down.
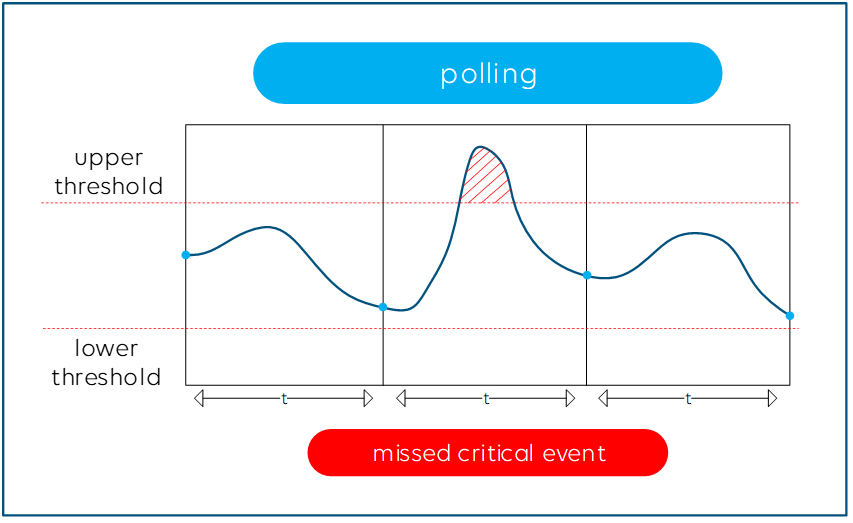
The higher you set the polling frequency in your NMS, the more accurate and closer to real time your data will be. However, you will likely cause higher CPU load on the switch and the polling might even affect the proper functioning of your network infrastructure when you poll all possible parameters as fast as your monitoring system allows.
Finding the right balance for your polling frequencies is key. While you want to poll the firmware version of a product only after a reboot of that product, for example, you do need to get notified as soon as possible when a network interface goes down, so that does require a high polling frequency. Make sure your monitoring system is able to define the polling frequency for certain groups of metrics or even for each metric.
Even with the highest polling frequency, there is still a small risk that you miss a little peak on a parameter, such as a high PTP timing offset that lasts only for a couple of milliseconds and happens right in between two polling cycles, but which could still cause major harm to your network.
Sending immediate notifications via SNMP traps may sound like a good solution, but this is not ideal either. Here is why: SNMP traps need to be configured on the network infrastructure itself (e.g. “send alarm when a network interface is down”) and with that you leave the alarm intelligence to the end device. That means you have no detailed control of the alarm behavior, e.g. the alarm severity or hysteresis settings. The level of detail available via SNMP and sent out via traps is also different from vendor to vendor, and vendors often use different notation for the same kind of event. In addition, SNMP mostly runs over UDP, so unless you use TCP, there is no guarantee that your NMS will get SNMP messages.
Telemetry streaming
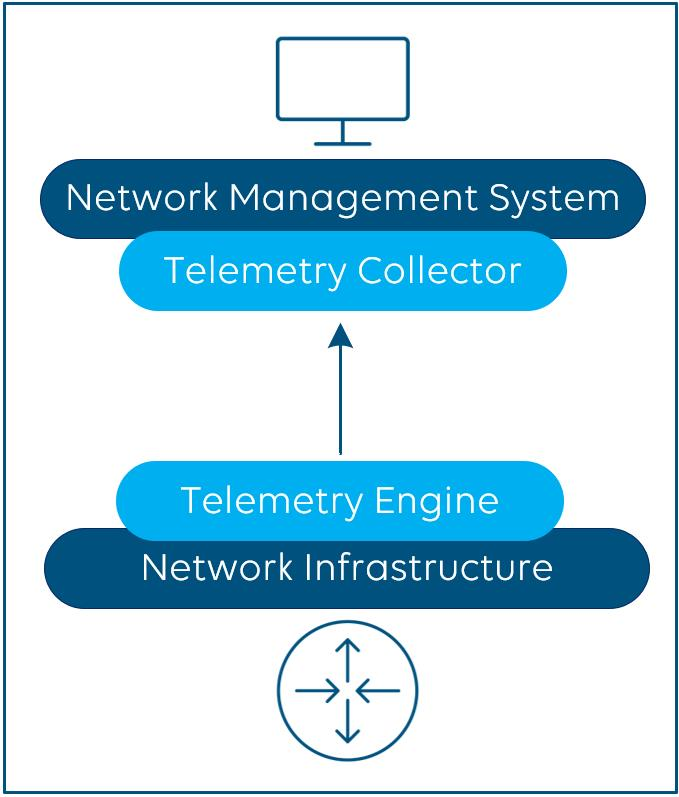
The concept of telemetry streaming overcomes the challenges discussed above. It is supposed to replace traditional polling and is based on a subscription-based push model to get near real-time data from a network infrastructure in a more efficient manner.
Telemetry clients (e.g. your NMS), also called collectors, subscribe to the telemetry engine of your network infrastructure (e.g. your switches). The latter stream, i.e. push data, to the collectors. Compared to SNMP and SNMP traps, streaming telemetry data is raw data, and the rules and intelligence when an event creates an alarm with a certain severity are up to your NMS. Telemetry streaming allows you to precisely define what data you want to capture and process, which is important as you don’t necessarily always want to monitor each possible parameter from your network infrastructure.
Dial-In and Dial-Out
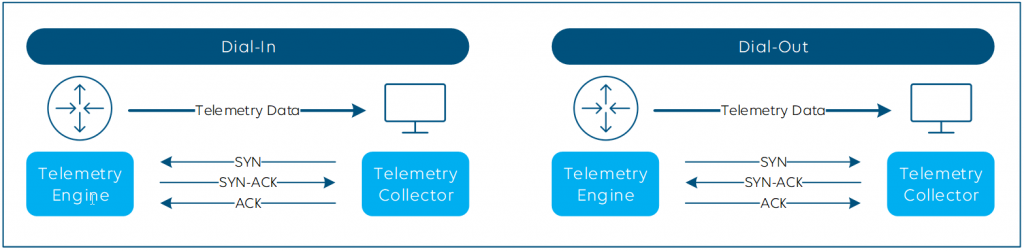
The initial session between the telemetry engine and collector can be established in two ways: Dial-In and Dial-Out.
- Dial-Out is seen from the switch perspective – the switch dials out to the collector. Your SecOps team will love that one, as the router initiates the connection, so there’s no need to worry about opening ports.
- Dial-In is the opposite. The switch passively listens for the collector until the latter dials in.
Dial-In is usually easier to configure, whereas some Dial-Out implementations come with more security, with encryption support and certificate-based authentication via TLS, but the same goes for (gNMI) dial-in. No matter which you choose, the telemetry data always gets pushed from the engine to the collector.
Telemetry streaming methods
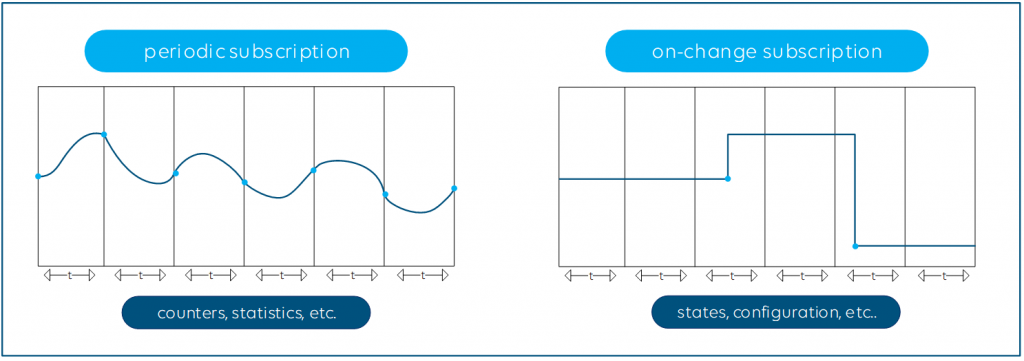
After you have established the connection, there are again different ways to stream the telemetry data: Periodic or On-Change.
- Periodic publication is perfect for counters or measures that constantly change, such as the current bandwidth utilization of your network interfaces.
- On-Change is the right choice for state parameters, which change at more random intervals, for example the admin state (up/down) of your network interface.
Compared to polling, the use of streaming telemetry can be much more efficient. First, it is up to the manufacturers to implement the streaming telemetry engine in such a way that the CPU and data plane cannot be affected under any circumstances. There must be no risk for the NMS to oversubscribe the switch or router CPU by heavy polling. And with the On-Change subscription capability, your NMS gets notified almost in real time of any change in your network.
That means there’s no longer a chance you’ll miss events that only last for a short period of time. Moreover, you also limit the amount of data flowing between the NMS and your network switches. Only when metrics are changing, will new data be sent. This makes inefficient polling of the same metrics with the same value multiple times in a row a thing of the past.
That all sounds great, right?
How to define, encode and transfer telemetry data?
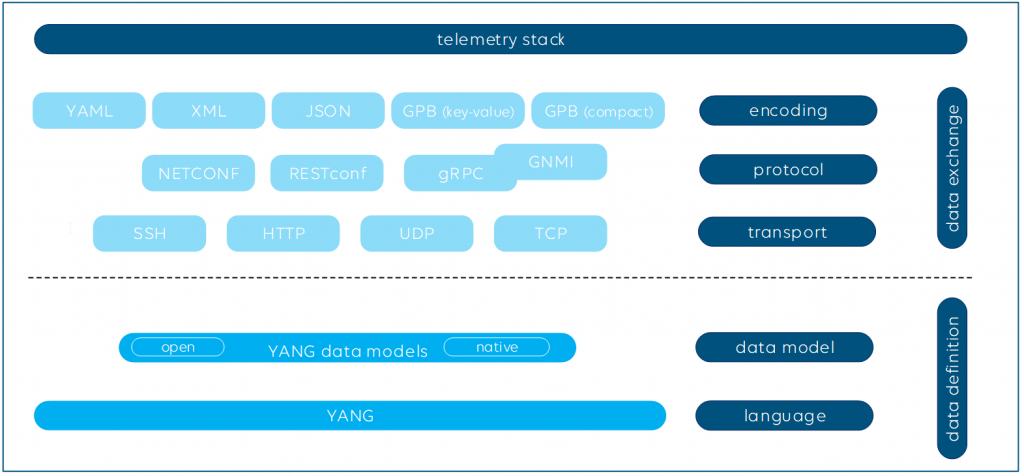
Streaming telemetry is often referred to as model-driven telemetry. Usually, YANG models are used to exactly define the telemetry datasets.
Defining a data model is not sufficient, though. The data needs to be encoded and transported to the telemetry collectors as well. The most common encoding formats to serialize the data are among others XML, JSON and GPB (Google Protocol Buffers). Commonly used transport protocols used for telemetry are NETCONF, RESTCONF and gRPC (Google Remote Procedure Call).
Plenty of possibilities, right?
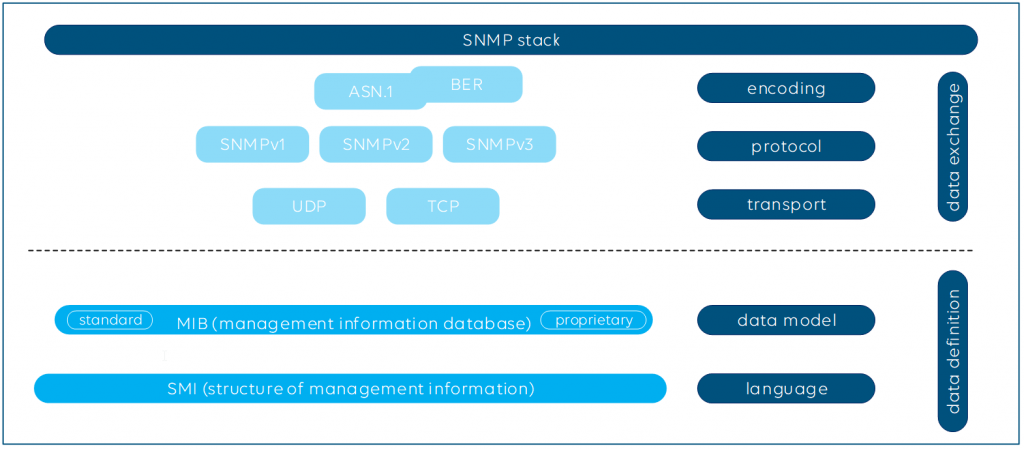
Here is what the protocol stack looks like for SNMP:
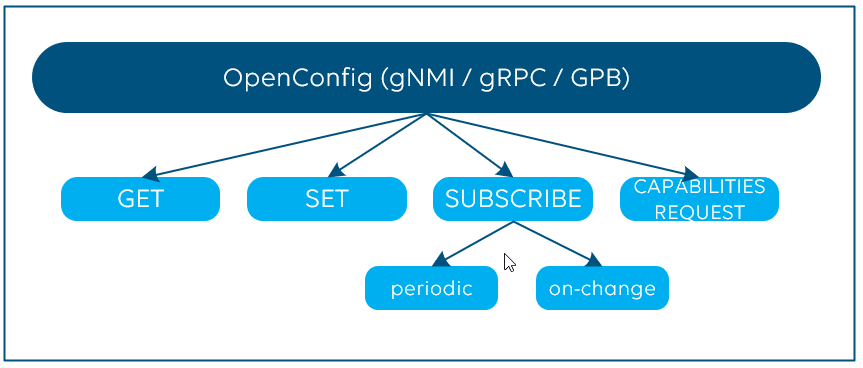
To add even some more acronyms here: Google’s gNMI (gRPC Network Management Interface), is a library and set of tools and uses gRPC Dial-In. The encoding format defined by gNMI is GPB. And what’s also important to know: gNMI also covers the configuration aspect of network infrastructure via “set” and “get” commands.
All the above combinations basically do the same; however, not every combination of encoding and transport layer is available on the market. Moreover, they vary in efficiency and ease of use. GNMI, i.e. GRPC in combination with GPB, is currently considered the most modern, feature-rich and efficient solution on the market. For example, the GPB serialization process using GPB compact mode uses binary encoding and is around 3 to 10 times more efficient than XML, which is text-based. This means that more data can be transported with the same number of bytes.
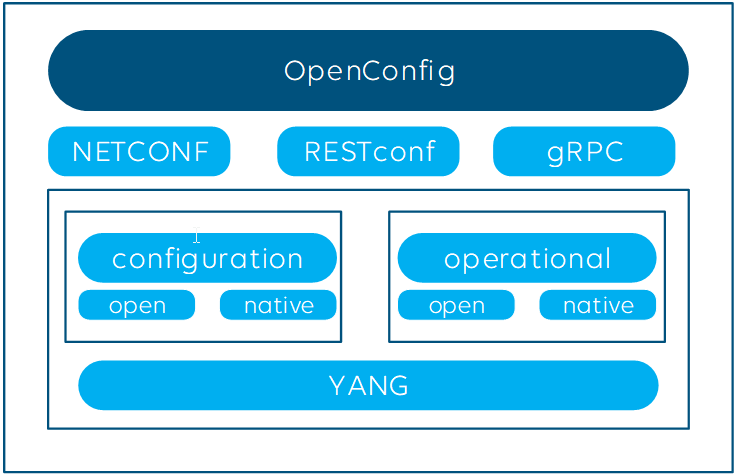
OpenConfig
In the context of streaming telemetry, you might have heard about OpenConfig. Let’s have a closer look at this. OpenConfig is defined as “vendor-neutral, model-driven network management designed by users” seeking to standardize network management and monitoring across vendors. You will find household names like AT&T, Google, Microsoft, Level3, Facebook, Netflix, Apple, British Telecom, Cox and many more supporting OpenConfig.
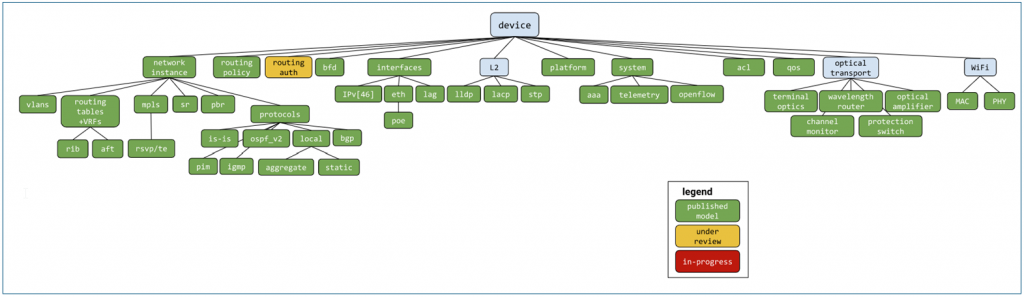
OpenConfig covers both monitoring using streaming telemetry (i.e. operational workflows) and the configuration of network infrastructure. First of all, it defines multiple open YANG models, which can either be fully or partially supported by the manufacturers, and leaves room for proprietary (native) YANG models next to it.
Although the initiative recommends using gNMI/gRPC, other encoding and transport protocols can be used as well.
OpenConfig is often seen as the solution for real-time telemetry streaming, especially as the on-change subscription model is supported. Don’t forget, OpenConfig (via GNMI) also supports cadence-based periodic subscription and “get” and “set” methods to poll parameters and to configure your network infrastructure and a capabilities request command which allows to retrieve the supported YANG models.
Many switch vendors support the above OpenConfig data model, which is great news. However, next to the open YANG model, each vendor also defines “native models” whenever some specific functionality is not yet supported in the open model. And even if your NMS supports both open and vendor-specific models, be aware that there are very likely also still parameters and features that are only supported via SNMP, Syslog, CLI or the proprietary protocols, and not via OpenConfig. So while OpenConfig definitely has its merits, it is unlikely that you can solely rely on it for all your needs.
OpenConfig alternatives
As noted above, OpenConfig is not standardized by any standards body. It’s an initiative of multiple vendors to streamline and standardize the management of network products. If you want to look into alternatives, have a look at IETF. The organization has published several RFCs (RFC 7923, RFC 8639, RFC 8640, RFC 8650, RFC 8641, etc.), all related to streaming telemetry using YANG, NETCONF, RESTCONF etc., but put into standards.
Network traffic telemetry
The concept of streaming telemetry is not only used to monitor and control network infrastructure, telemetry is also a great tool to get an in-depth view into network traffic, which is then referred as “network traffic telemetry”.
Many switch vendors support flow export protocols such as SFlow, NetFlow or JFlow. Flow agents run on the switches and collect sampled or non-sampled data. The latter gets pushed out to one or multiple flow collectors, which can be your NMS again. This is great technology; your media operations team can easily troubleshoot compressed and uncompressed video and audio multicast traffic, and your IT team will use flow dashboards to analyze IT traffic over time and identify potential bottlenecks in the network.
Conclusion
The concept of shifting from polling data to streaming telemetry is great. Data can be sent incrementally, i.e. this only creates network traffic when something changes. Data is available in a well-structured format and can be transported over a secure, authenticated and reliable channel.
However, be aware that even initiatives such as OpenConfig do not lead to a situation where a single interface (i.e. connector) can be built to support each and every metric required for your operational monitoring and configuration needs in your multi-vendor network infrastructure.
There are and always will be slight differences in features, protocols and APIs supported by each vendor, as well as differences in their associated data models, and also in the data encoding and transport. Proprietary vendor protocols will continue to exist in the future, because these allow vendors to support their own unique features and set themselves apart from competition.
Whenever you have a choice between multiple technologies, we tend to say the market will decide which protocols and solutions will dominate over time. Is it worth spending multiple years defining an exact specification first, or is an open-source initiative, which allows fast definitions of new data models, the better approach? The only thing that is 100% clear is that you cannot and do not want to wait until the perfect solution is available.
You should therefore make sure that your network management system supports every possible mix of data models, data protocols, encoding formats and transport protocols to retrieve and configure the exact data you need. With that in place, you can already start today, and you have the guarantee to invest in a future-proof solution!
You can be assured there will be new data models and protocols coming up again soon!