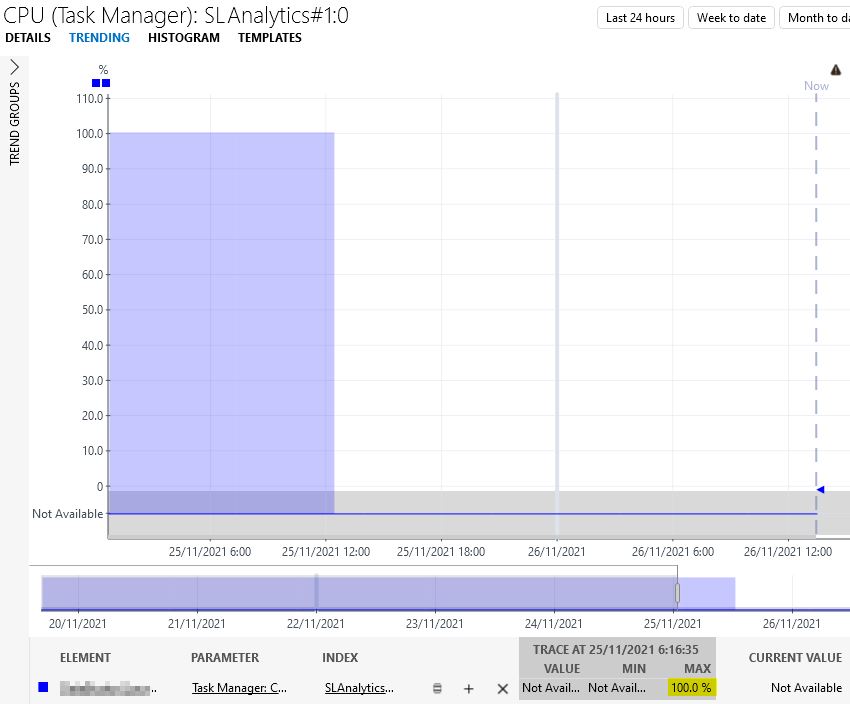
I’m requesting trending from a Task Manager table column in the Microsoft Platform element.
When requesting this from a process that is not available anymore then I see that from the average trending it’s showing “100” as maximum value, even though that process did had the exception value at that time:

I’m seeing this “100” value for all missing processes and for all monitored columns: CPU, VM Size, Threads, Handles,…
When hovering over the “realtime” trending part (last 24hrs) it’s not showing this maximum value. So I doubt that there would be a glitch in the driver itself that would be briefly setting value 100 as then I would expect it to also show up there.
I’m wondering if this is an issue in software or if there is some kind of configuration wrong that has to be adapted? Or would there still be something wrong in the Microsoft Platform driver that is causing this?
The used DataMiner version is 10.1.12.
Hi Laurens, I seem to have the same on a Linux element, I added my observations to the task you created.
Conclusion so far, not related to the MS driver.
Hi Laurens,
I believe discrete parameters and continuous parameters that have an exception value for a long time (ex. ‘Not Available’) the avg records contain the ‘most occurring value’ and ‘percentage in the time interval of the most occurring value’ in their min/max value. I guess Cube trend does not interpret those values that way and thus showing wrong min/max shading.
We’ll use the task you have created to fix this.
To be able to track this later: task 172316 has been created for this