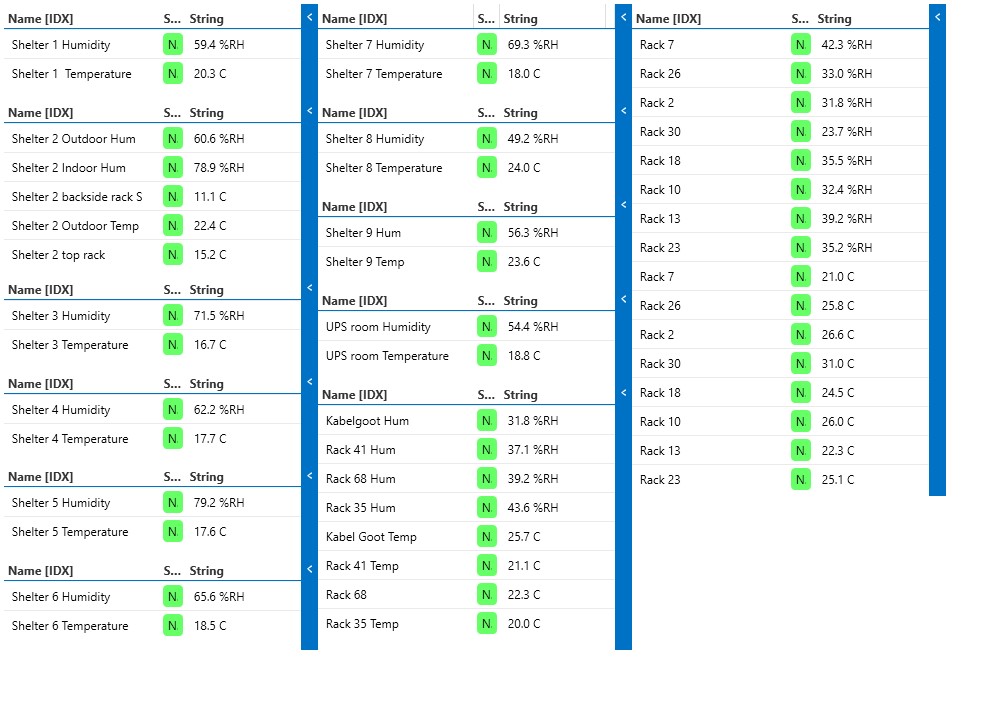
I'm trying to create a summary visual including all our environmental data.
In order to do so i'm adding multiple tables in a visiodrawing but i'm hitting some speedbumps.
- (How) Can i hide the column header of a table?
- (How) Can i hide the "Blue arrowed details thingy ;-)" on the side of the table?
- (How) Can i sort on the sensors names in the "Name [IDX]" column? (tried Sort without success)
As this question has now been inactive for a very long time, I will close it. If you still want more information about this, could you post a new question?
Hi Jurgen,
As far as I'm aware, it's not possible to hide the headers and sidebars of the tables.
As an alternative, you could consider dynamically generating shapes for each row of the table as described in Generating shapes based on table rows | DataMiner Docs.
Note that the row shapes can also be groups, so you could create a group that shows the Name and values and the generate that for each row.
Using the dynamically generated shapes, you can also add the "ChildrenSort" option to set the sorting.
For more details, you can also watch this video in our Visual Overview training course: Generating shapes based on table rows - DataMiner Dojo
Thanks for the ninja-style response time Michiel 😉
I’ll explore the dynamically generated shapes.

I see that this question has been inactive for some time. Do you still need help with this? If not, could you select the answer that has been most helpful for you (using the ✓ icon)?