Hi All,
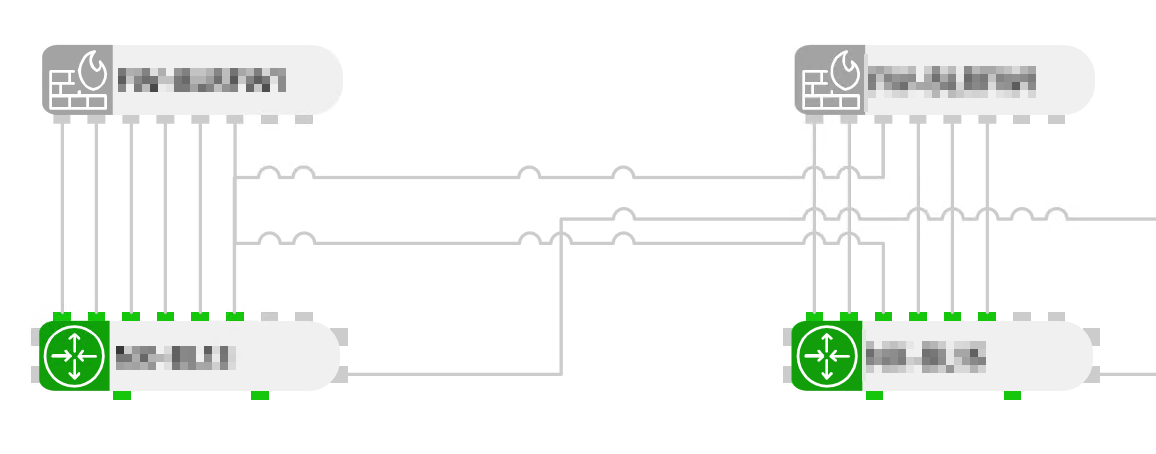
I am currently working on a Visio diagram to visualize the connectivity of complex network devices (e.g., firewalls, load balancers, switches, VPNs, etc.). This diagram provides a visual overview of the connections between the interfaces of these devices. However, both the interface status and these connections are manually hardcoded and drawn, as DCF is not implemented for most of the drivers. Below is an example of the interface connectivity between devices:

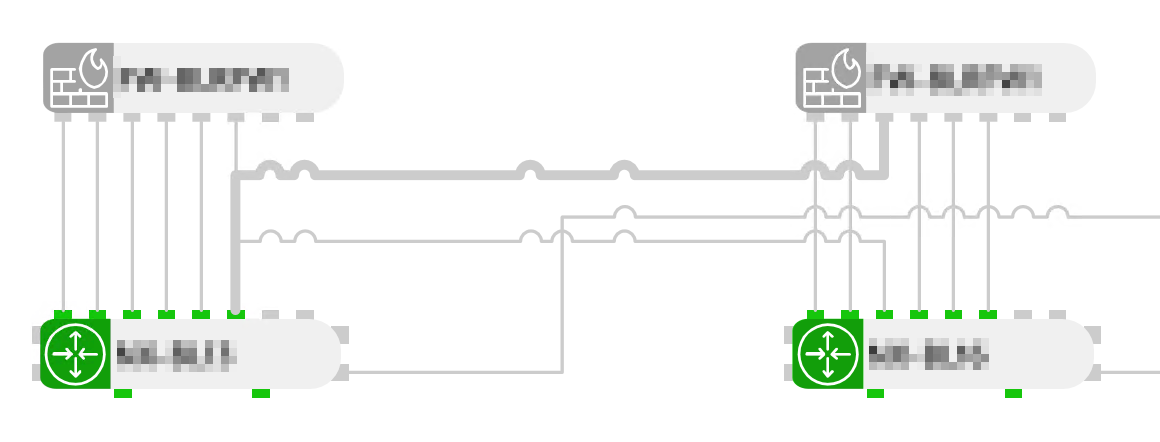
Since some of the connectivity lines overlap, I would like to implement a feature where, when a user clicks on a line, it highlights or becomes bold (as shown below) to help users clearly see how the interfaces are connected between devices.

Could anyone advise on how to achieve this using Visio Shape Data?
I tried a couple of things but it seems like using overlapping lines with show/hide conditions is your best bet.
For this, you’ll need to add a couple of important shape data values to your lines to achieve this and make sure they show nicely:
- SetVar: This one is needed to set a variable on which you will then evaluate your show/hide condition.
- Show/Hide: Of course, evaluates your variable to show/hide the thickened and normal line.
- SetVarOptions: Control=Shape ensures your setvar doesn’t change into a button.
- Options: HoverType=Geometry ensures you don’t get a bounding rectangle overlay box when hovering over a line.