

I would like to create a DataMiner visualization (visio) that retrieves data from the Alarm Table and automatically filters the alarms based on the name of the current view.
The visualization should display only the following alarm information:
- Element Name
- Parameter Description
- Current Value
- Root Time
- Severity
The filtering should be dynamic, so that when the visualization is used within a specific view, it only shows alarms related to that view.
The goal is to provide a clean and focused alarm overview for operators, showing only the most relevant alarm details associated with the selected view.

Hi Tim, I believe the following will work for what you are looking for.
For the Visio associated with the View, create a new page (i.e. [ViewAlerts])
Add a shape for each of the alarm parameters you want displayed (Element name, Description, Value, Severity etc). For the Shape Data use Alarm with value * and Info with value [alarm parameter name] (Element Name, Time, Parameter Description, Severity, etc)
Group these shapes together, and add a Shape Data to the group for ChildType with value Alarm
Then add another shape to represent the size you want the alarms displayed in. Create a new group with this shape and the previously created group. Add shape data to the group for Children with value Alarm, Element with value 'This View', other shape data can be added for sort, options layout and other abilities but not needed for core functionality.
Apply this Visio to the view and you should now see a list of alarm associated with the view.
Now from your main Visio you can add a shape which links to this view/page (passed as a variable) to display the ViewAlerts page.
Manual references -
Generating shapes that represent alarms | DataMiner Docs
Making a shape display a particular page of the current Visio drawing | DataMiner Docs
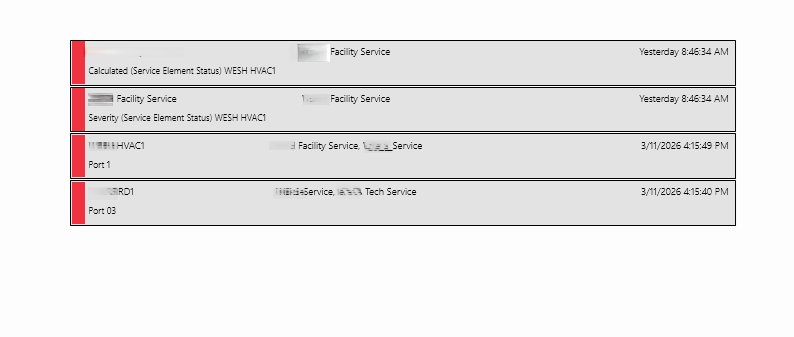
Sample display showing view related alerts with Severity as side led, Element Name, Services, Time and Alarm Description.
Kind Regards,
Steve

thanks