Hi Dojo,
I need to find out what Elements and Services are Masked. The Alarm Console filters can only show me Elements for currently active (or historical) alarms, but not the state of Elements or Services.
Another Dojo post suggested using the Surveyor Root View, which does work for Elements, but not for Services. Is there a way to see this information, either with Cube or Dashboards?
Thanks
As this question has now been open for a long time and there has been no further reaction from you, I will now close it. If you still want more information about this, could you post a new question?
Hi Dave,
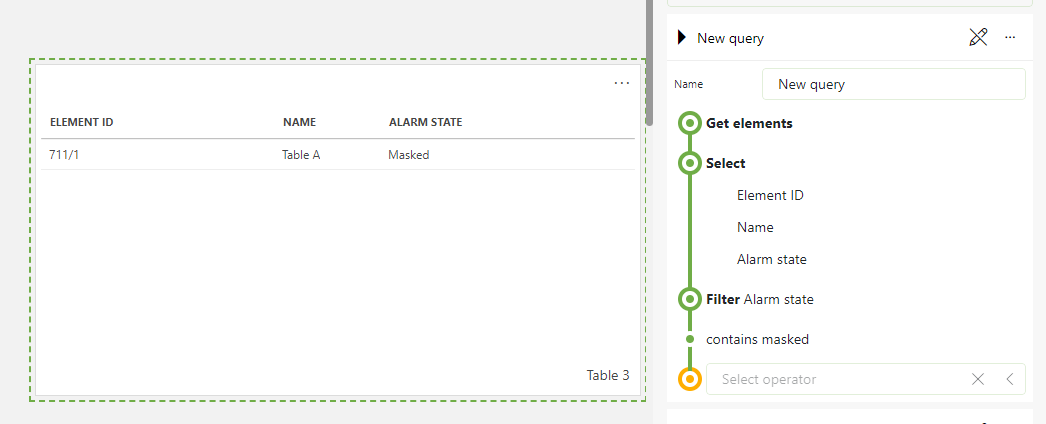
By using GQI, in Dashboards, you can create a query that fetches all elements having a masked alarm state.
You can do the same for services.

Hope this helps!
Best regards, Ward
Thanks for the suggestion Ward. It certainly works for me with Elements as you describe, but not for Services. Services are showing as “Normal” State with the GQI, which is actually what I can also see in Root View/Services. So I don’t know if this is an issue in my DMS or in the version of DataMiner that I am running (10.3.4)
Hi Pieter,
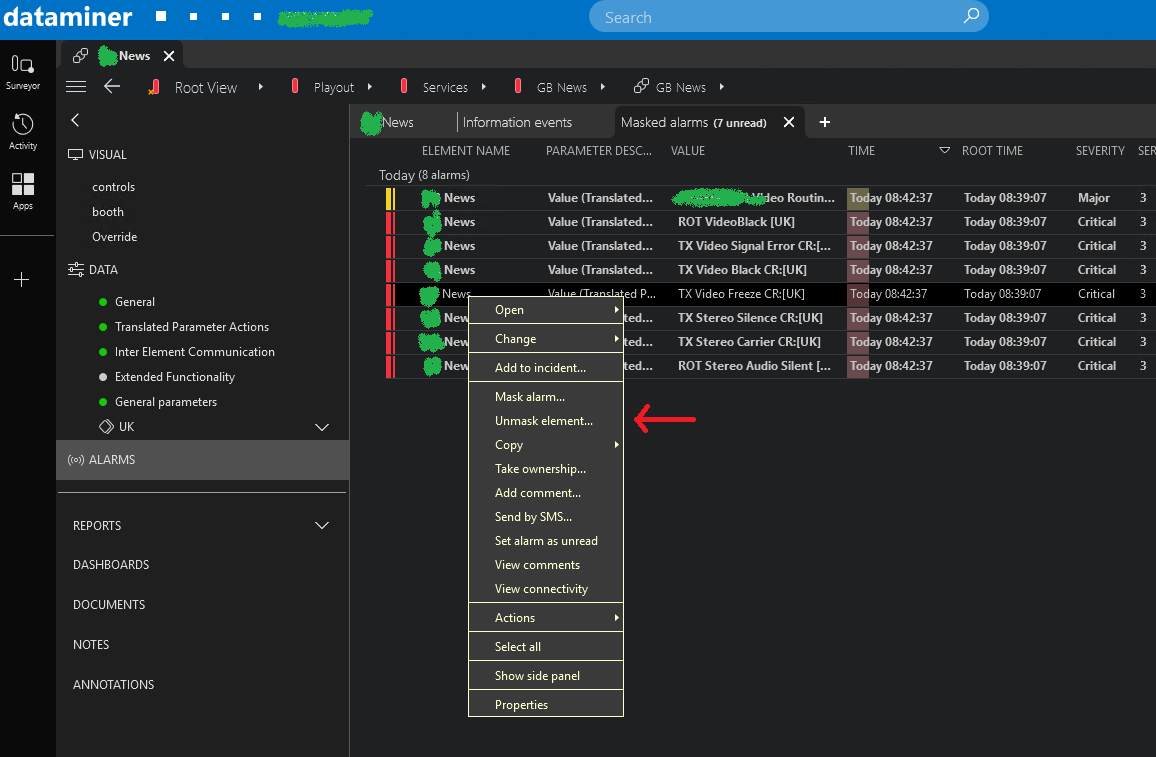
I should have clarified that these are enhanced services. When right clicking on an alarm for the enhanced service, I have the option to Mask Element.
Once the alarms are masked, I can see them in the Masked Alarms tab of the Service, and right clicking on one of the alarms shows the option to Unmask Element:

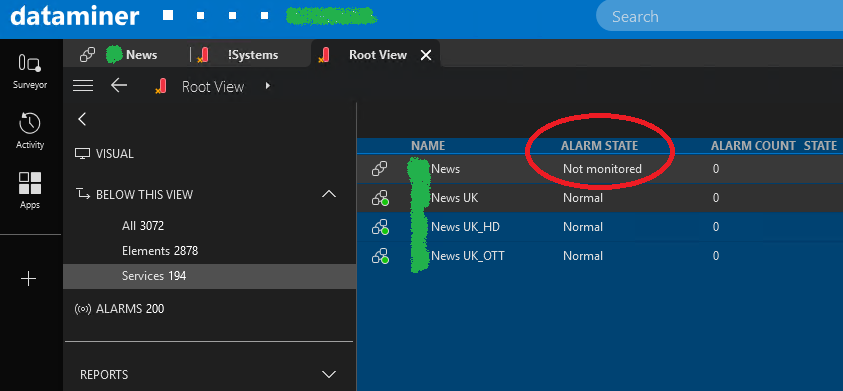
On closer inspection it seems that in Root View (and a GQI Dashboard) the Service that I have masked the element of shows the Alarm State of “Not Monitored”

So with a bit of GQI manipulation, I might be able to create the dashboard I am after, but I would need to make sure I excluded enhanced services that didn’t have alarm templates set.
-> Minor correction – the Masked Service shows as “Not Monitored” in Cube, but “Undefined” via GQI
Hi Dave,
The alarm state ‘Not monitored’ comes from what you have included in your service I believe. So, I’m not sure that will give you want you need.
In order to create a list of service-Elements in dashboards you could add a node of ‘Get Parameters for elements where’ and then select protocol and your specific enhanced service protocol. That will give you a full list of service-Elements. Depending on the protocol, there might be a trace of ‘masking’ in one of your parameters in that element. If that’s the case, it’s just a matter of including that parameter and you’re done.
In case you don’t have such a parameter in your enhanced service protocol, we can use the ‘general’ parameter with name [Element alarm state] ID 65008 in an adhoc GQI data source. General parameters are built-in parameters that are available in all elements. In such a GQI ad hoc data source, I would suggest to first get all your service Elements (via GetInfoMessage(InfoType.ServiceElementInfo)) and then for each service element get the parameter with ID 65008 (GetParameterMessage)
Are you familiar with ad hoc data source in GQI already Dave?
Hi Dave,
Can you clarify what you mean with a ‘masked service’. To my knowledge you can mask alarms, parameters & elements (and EPM objects), but not services. Services will indeed show ‘Normal’ when everything in that service is masked (same as views)
Hi Dave,
Have you been able to find a solution for this based on the answers below?