I am trying to design a Visio page for Dataminer that uses gradient fills to show that different media transport interfeaces can be used by a piece of equipment. The Visio shows it fine, but on Dataminer it shows as a solid fill. Can anyone please advise if it is possible to get this working?
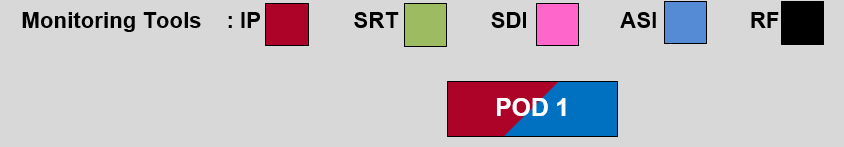
Visio
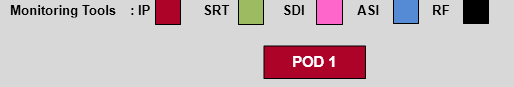
Dataminer
DataMiner tries to render the Visio file as good as possible, but there might indeed be certain options in Visio which are not rendered exactly the same as in Visio. Then I would recommend trying to work around that with displaying your data in a different way.
I assume the color-coded legend with the different monitoring tools is fixed. But is that fill of that POD 1 fixed or dynamic (=with dynamic I mean linked to values in DataMiner and dynamically changing in DataMiner)? In case it is fixed, you could create 2 shapes with 2 different colors in inside that rectangle. But not sure if that would be a workaround for your use case.
Alex, here is the Visio reference for using Extended Conditional Shape Manipulation to show or hide shapes using multiple shapes as Bert referenced.
I see that this question has been inactive for some time. Do you still need help with this? If not, could you select the answer (using the ✓ icon) to indicate that no further follow-up is needed?