Hi Dojo, just a quick follow up from https://community.dataminer.services/question/default-trend-behaviour-n-a-or-exception-values-vs-timeout-gaps/
I understand that by default we'd have a vertical line only when there is a transition across normal values.
In case of discontinuity on a trend (no vertical line / exception values), what is the default behaviour for connectors?
Should a horizontal "gap" be always present in case of element timeout?
Asking to be able to tell the difference between an "exception value" discontinuity VS a timeout discontinuity and possibly implement different exception values within a bespoke connector.
This is in the context of some legacy internal drivers that were incorrectly showing a flat-line when a timeout is present.
Thanks
Hi Luca, Exceptions are displayed in a separate bar below the actual trend graph, while timeouts are shown as gaps without a line in the exceptions bar.
I'll try to illustrate with some screenshots from a test connector:
1) Exceptions: There is a gap in the main graph, but a line is displayed in the separate exceptions bar. The exception is labelled as "BROKEN" in this example.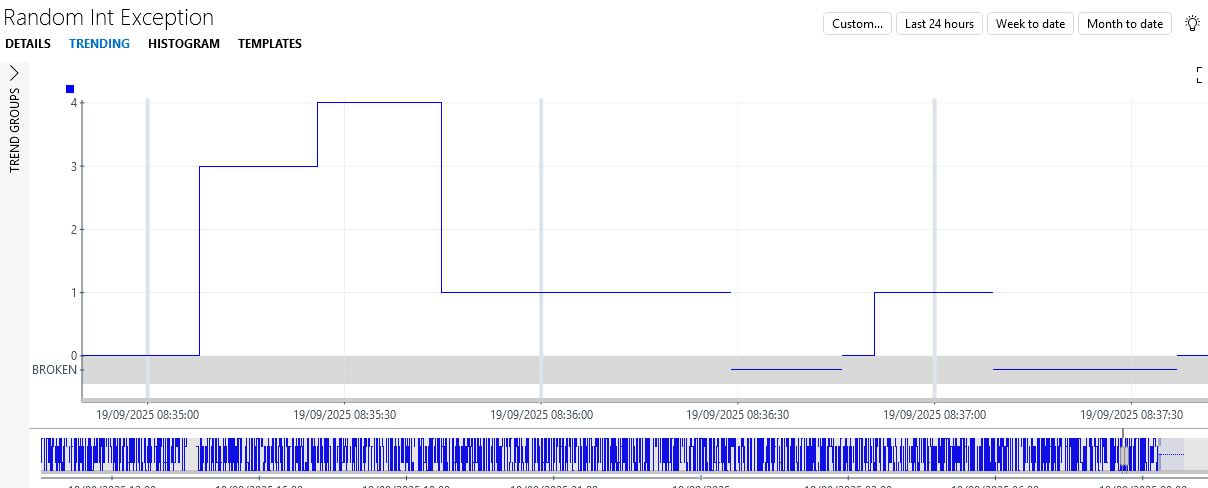
2) Timeouts: These are shown as a gap without a line on the exception bar, even if the exception bar is present.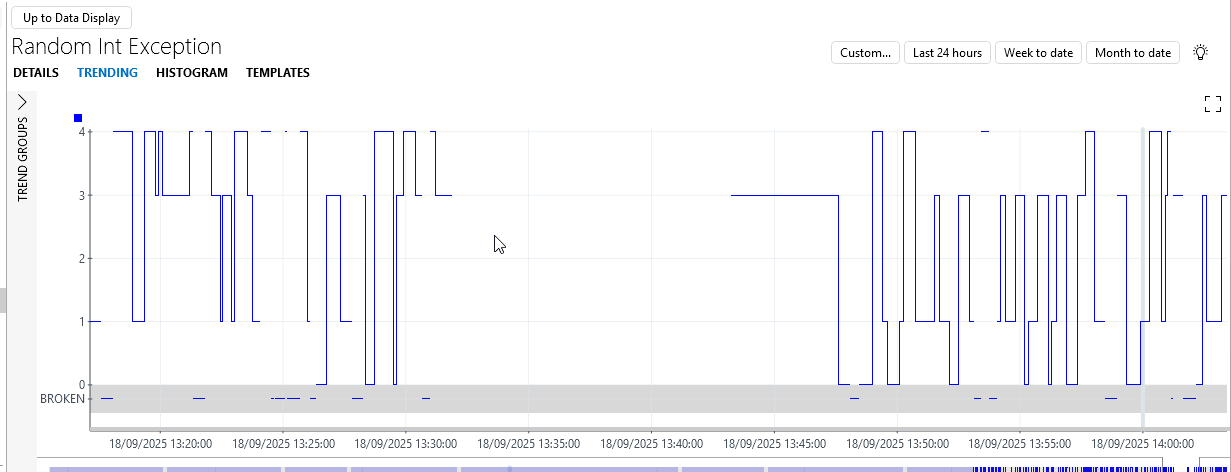
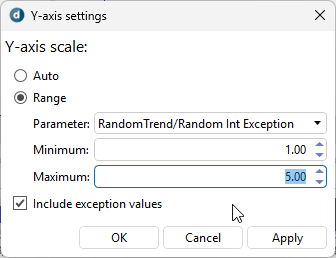
3) Note that if you apply custom Y-Axis settings, exceptions can be included or excluded here. If they are not included, exceptions will look identical to timeouts.
Thanks for top notch examples, Michiel – that's exactly what I was looking for!
Marking as solved