Could you please tell me how I can zoom in the timeline of trending at Dashboard ?
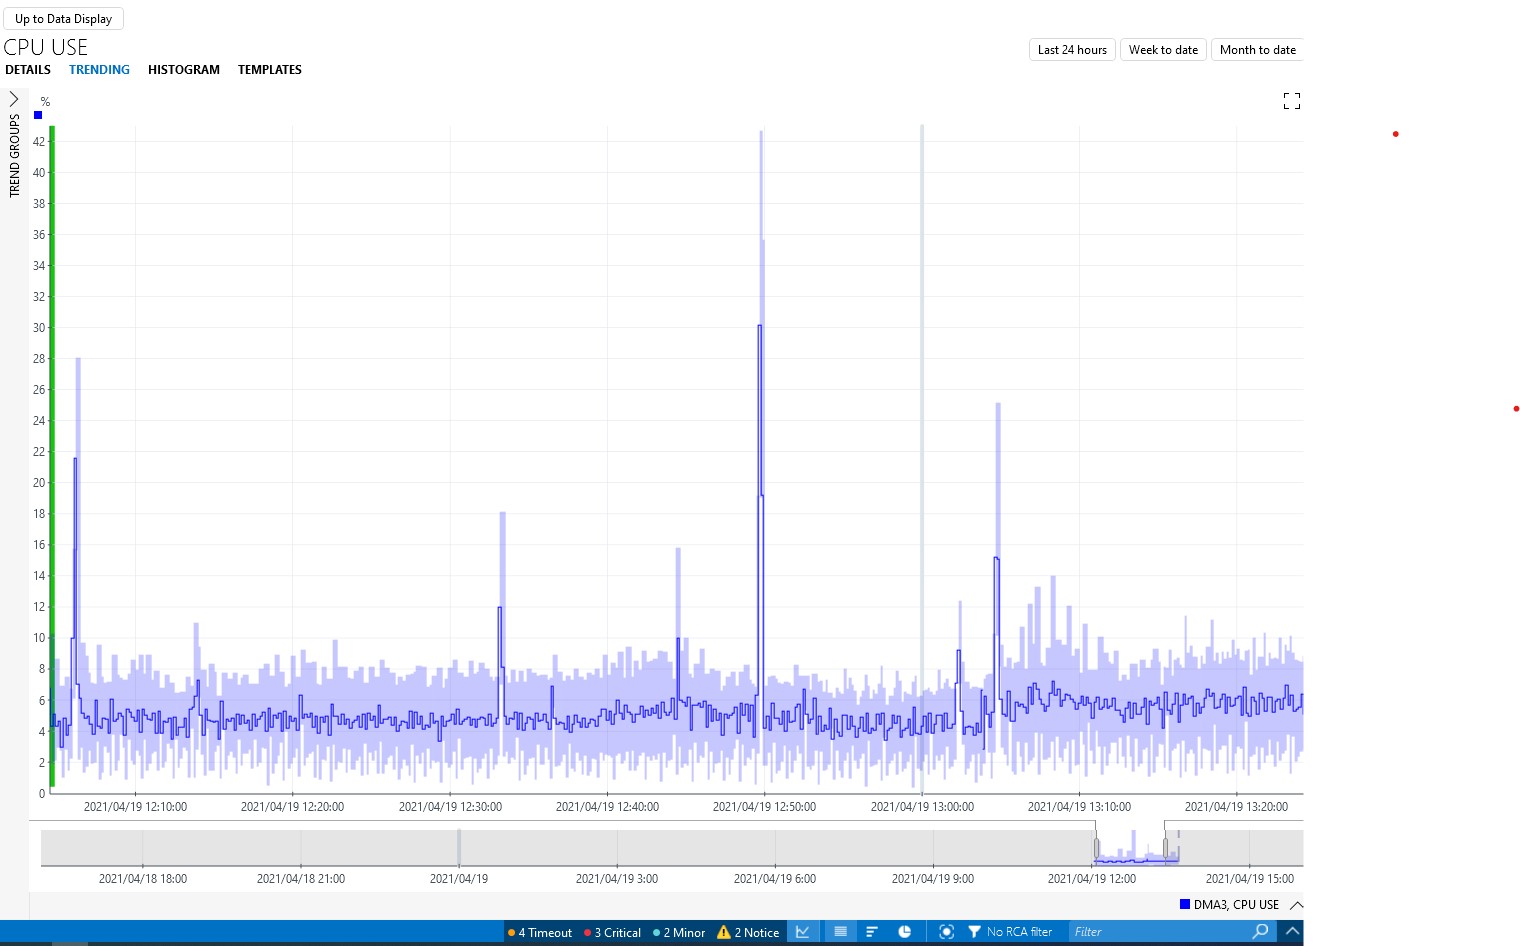
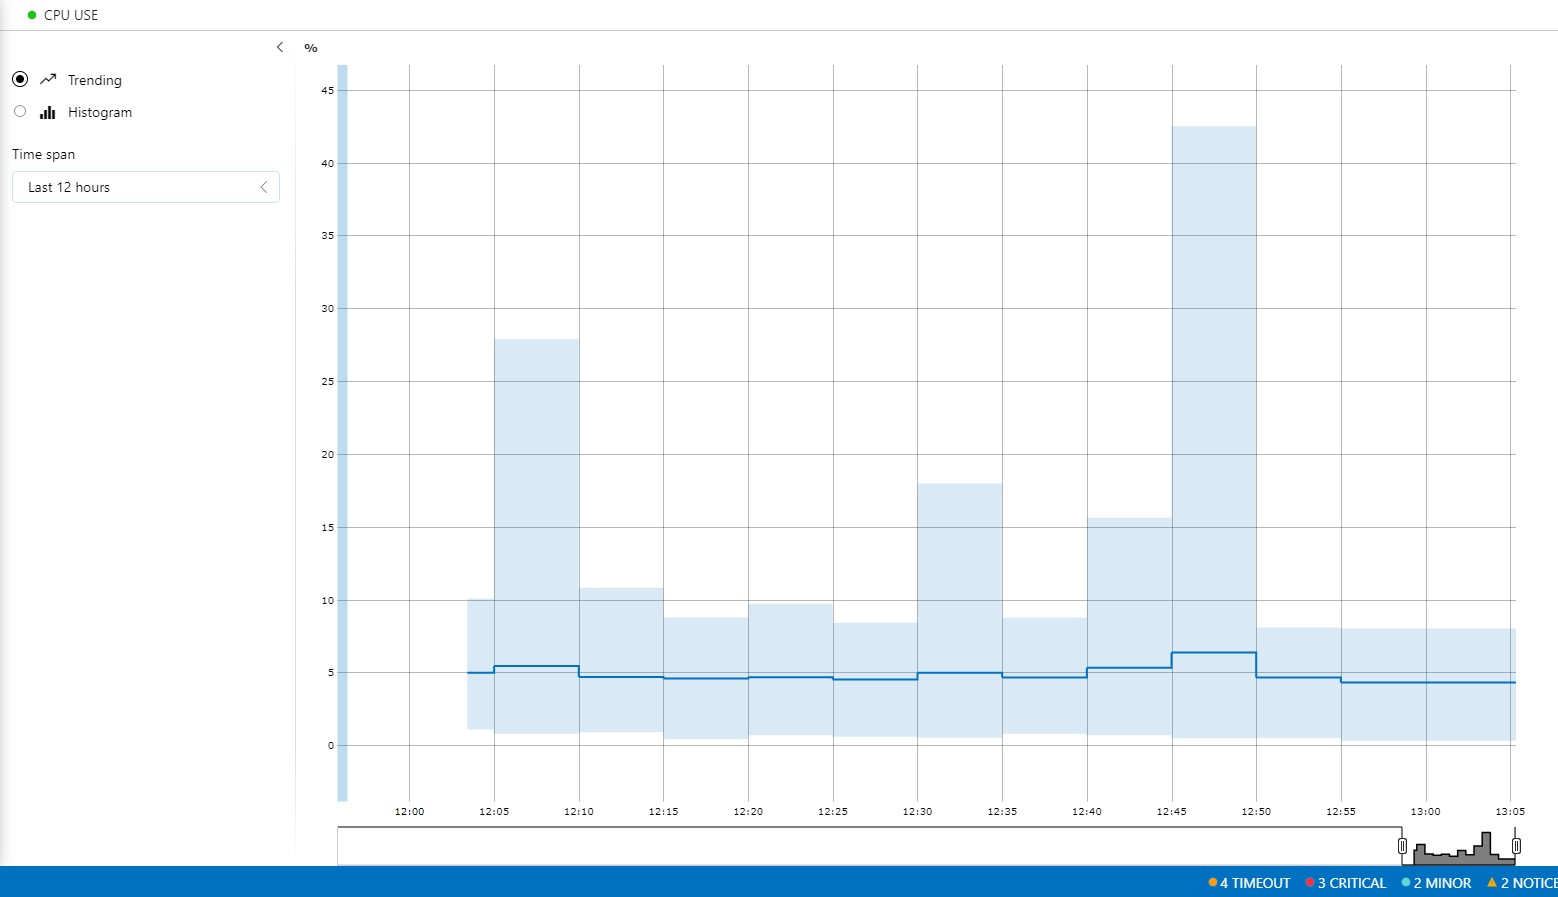
I can change the time span of the Trending, but the data sampling rate does not change, while the Trending sampling rate changes at Cube when you zoom in to the time line.
Please see the screenshots from both for the exact the same time range.


Looks like the sampling rate of trending display at the new Dashboard is fixed to every 5mins.
It doesn’t change even if I select the Time span to be “Last 5 minutes”.
Is it by design ?
Hi Mahito,
The Cube component is automatically switching between real-time values and averaged values based on the visible time window. The mobile monitoring component does not have this capability and is always displaying aggregated values.
Note that in dashboards you can configure which values should be displayed in the component settings of the line chart.

Hi Mahito,
Thank you for your question. The sampling rate is at 5 mins as the Trending is only showing average Trend data.
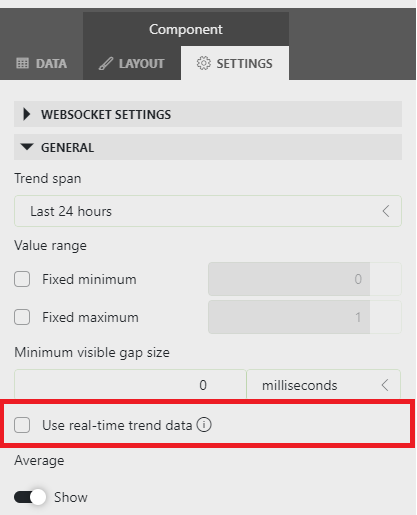
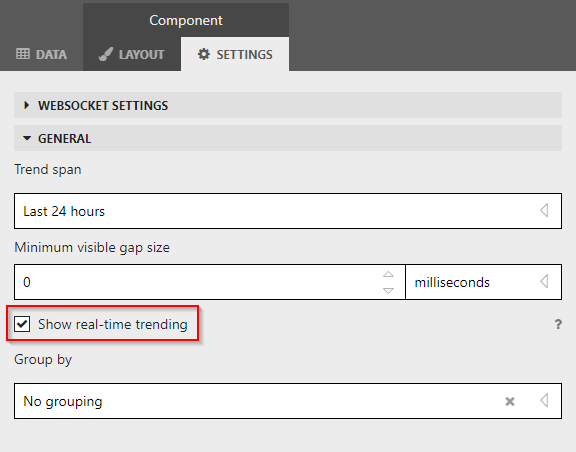
There is a settings tab for each Dashboard component, where you can enable Real-time trending for that parameter.
Cube Dashboard:

New Dashboard:

I hope this helps!