Hello everyone, I have a case similar to this question:
There is a parameter associated with a certain type of element that does not usually have many variations. When this happens, the trend is not fully displayed, it seems that the value is not being received, however, the value is received correctly.
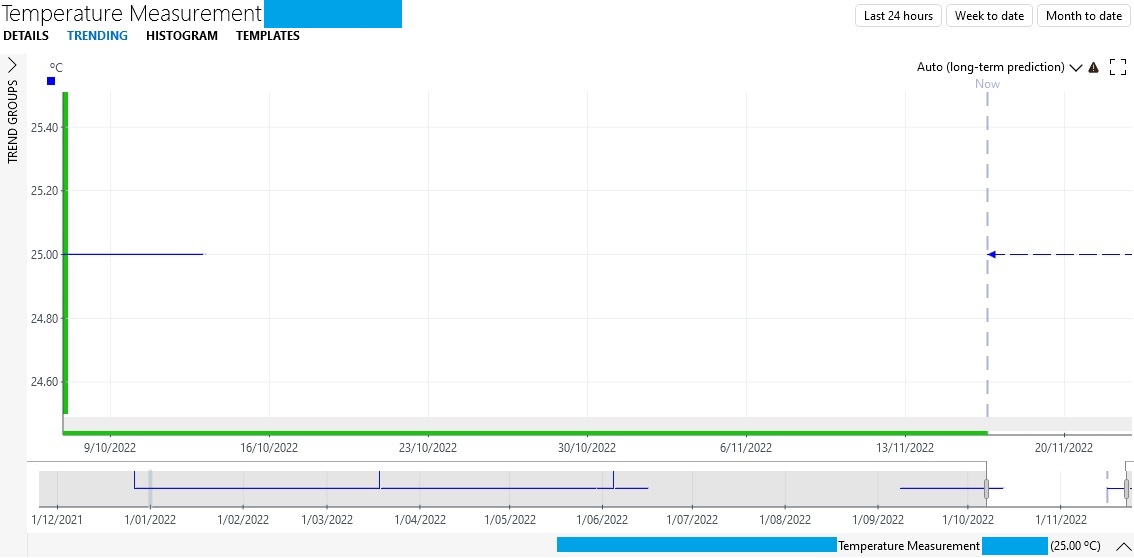
I would like to know if this is a normal behavior of a trend chart or is it a problem with the version of Dataminer Cube.
The version of Cube that is being used:
Server version : 10.2.0.0-11517
Client version : 10.2.2143.6048
Launcher version : 10.2.2143.5086
Thanks.
Hello Miguel,
That’s right, there are other elements that use the same connector, and I also see the same behavior in said parameter. In these cases the temperature value has not changed for several months. These elements have not stopped for six months.
The value has not changed, the drawback is in the visibility of the trend graph. Through the stream viewer we have verified that the parameter is received normally.
Thanks.
Hi Isabel,
Just curious, if you right click in the trend area and set a custom y-axis, then go back to the auto y-axis setting does your display change?
This would accommodate if there were large fluctuations in the data being collected, which I would not expect for temperature, but maybe bad data coming from the collection process.
Hi Steve.
We did what you said about the Y-axis. But we still don’t see part of the graph, mainly in the last few months. We extracted the data from the trend graph in CSV format and we see that it only has information up to October, after this month it no longer has more data, however through stream viewer we see that the value continues to be received normally.
As you say, maybe it’s a collection or processing problem, we think it could be associated with the connector(driver).
Thank you very much for your comments!.
The “correct” behavior should be the following:
a flat line should always be a full line except when you pause or stop the element but also when you have a timeout, but looking at the green bar below this isn’t the case.
There is something specific for stable points compared to values that often change, let me explain:
To reduce the amount of data on the database (=save significant amount of disk space) we only store a trend point when the value changes but we write also a point when you stop & start an element which means also when you restart your DMA to show the gaps correctly
if, for some reason, the point of startup did not enter the database, you can have the behavior shown in your picture. Also note that the code base is different between MySQL, Cassandra & Cassandra cluster so this will be key information to know the root cause of the issue.
So what i would suggest, could you provide a DELT package of such an element (including the trending)
Exporting elements, services, etc. to a .dmimport file | DataMiner Docs
together with a SLLogCollector package (SLLogCollector | DataMiner Docs) to techsupport@skyline.be
This way we have the information of which kind of setup you have and we can simulate this in our environment to hopefully identify the root cause why you are missing some points.
Thanks Marlies for yours comments, it’s helped to understand the behaivor of constant values.
We’ll keep in mind the mentioned suggestions to analyze this situation. We did’t find the root causes of the problem, but after udgrading the cluster to version 10.2.0.0 CU10, we could see the trend graph of the temperature parameter.
Hi Isabel,
I believe it is not the same case as the question that you put as reference. In your case, it is a numerical value (temperature).
Do you have other elements using the same connector, and if so, do you see the same behavior?
Do you recall if the element was stopped recently?
When the temperature value changes, what is the value that you see displayed in the parameter?