Skip to content
DataMiner DoJo

More results...

Generic selectors
Exact matches only
Search in title
Search in content
Post Type Selectors
Search in posts
Search in pages
Search in posts
Search in pages
Log in
Menu
  • Updates & Insights
  • Questions
  • Learning
    • E-learning Courses
    • Empower Replay: Limited Edition
    • Tutorials
    • Open Classroom Training
    • Certification
      • DataMiner Fundamentals
      • DataMiner Configurator
      • DataMiner Automation
      • Scripts & Connectors Developer: HTTP Basics
      • Scripts & Connectors Developer: SNMP Basics
      • Visual Overview – Level 1
      • Verify a certificate
    • Video Library
    • Books We Like
    • >> Go to DataMiner Docs
  • Expert Center
    • Solutions & Use Cases
      • Solutions
      • Use Case Library
    • Markets & Industries
      • Media production
      • Government & defense
      • Content distribution
      • Service providers
      • Partners
      • OSS/BSS
    • Agile
      • Agile Webspace
      • Everything Agile
        • The Agile Manifesto
        • Best Practices
        • Retro Recipes
      • Methodologies
        • The Scrum Framework
        • Kanban
        • Extreme Programming
      • Roles
        • The Product Owner
        • The Agile Coach
        • The Quality & UX Coach (QX)
    • DataMiner DevOps Professional Program
      • About the DevOps Program
      • DataMiner DevOps Support
  • Downloads
  • More
    • DataMiner Releases & Updates
    • Feature Suggestions
    • Climb the leaderboard!
    • Swag Shop
    • Contact
    • Global Feedback Survey
  • PARTNERS
    • All Partners
    • Technology Partners
    • Strategic Partner Program
    • Deal Registration
  • >> Go to dataminer.services

Trend Graph Average Calculation

Solved1.19K views12th October 2023
1
Muhamad Nor Iman Hasan253 10th October 2023 0 Comments

Hi Dojo / Support,

We would like to know how the data from Dashboard Trending graph was produced

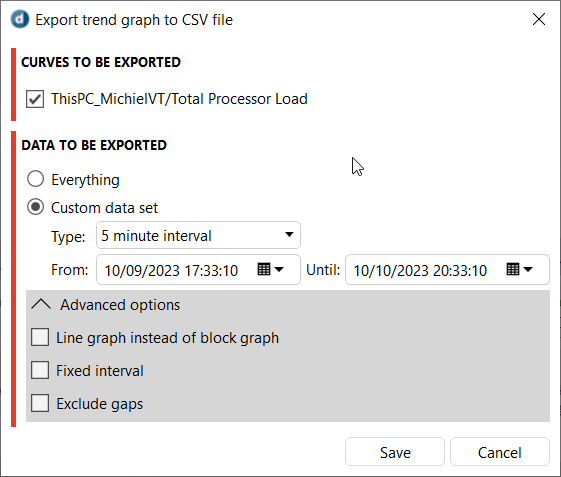
Below is the example of data from trend graph dashboard that we set trend points as real time from 4:00 PM to 5:00 PM when we export to CSV:

Kindly advise :

  1. What formula is being used to calculate the data?
  2. Based on the example given, the outcome of the calculation will be recorded at either 4:00 PM or 5:00 PM?

Thank You.

Marieke Goethals [SLC] [DevOps Catalyst] Selected answer as best 12th October 2023

2 Answers

  • Active
  • Voted
  • Newest
  • Oldest
1
Michiel Vanthuyne [SLC] [DevOps Enabler]4.16K Posted 10th October 2023 1 Comment

Hi Muhamad, the average of the values between 4:00PM and 5:00PM will be calculated at 5:00PM and in DataMiner Cube this will be displayed as a flat line between 4:00PM and 5:00PM, together with a lighter colored block that indicates the minimum and maximum values in that timeslot. When you do an export to CSV, you in the advanced options you can use between a line graph, which will put the points at the end of the interval and create a continuous looking graph, or the default block graph, which will export a point at the start and end of the timeslot so a plot based on the export will produce a similar graph to the one in DataMiner Cube.

Marieke Goethals [SLC] [DevOps Catalyst] Selected answer as best 12th October 2023
Muhamad Nor Iman Hasan commented 11th October 2023

Well noted, Thank You !

1
Wale Oguntoyinbo [SLC] [DevOps Advocate]3.42K Posted 10th October 2023 1 Comment

You can find a nice explanation in this question of how average trend values are calculated. Hope it helps.

Muhamad Nor Iman Hasan Posted new comment 10th October 2023
Muhamad Nor Iman Hasan commented 10th October 2023

Hi Wale,

I appreciate the reference provided. I executed the calculation.
However, the answer to my second query is still pending.

Could you advise?

Please login to be able to comment or post an answer.

My DevOps rank

DevOps Members get more insights on their profile page.

My user earnings

0 Dojo credits

Spend your credits in our swag shop.

0 Reputation points

Boost your reputation, climb the leaderboard.

Promo banner DataMiner DevOps Professiona Program
DataMiner Integration Studio (DIS)
Empower Katas
Privacy Policy • Terms & Conditions • Contact

© 2025 Skyline Communications. All rights reserved.

DOJO Q&A widget

Can't find what you need?

? Explore the Q&A DataMiner Docs