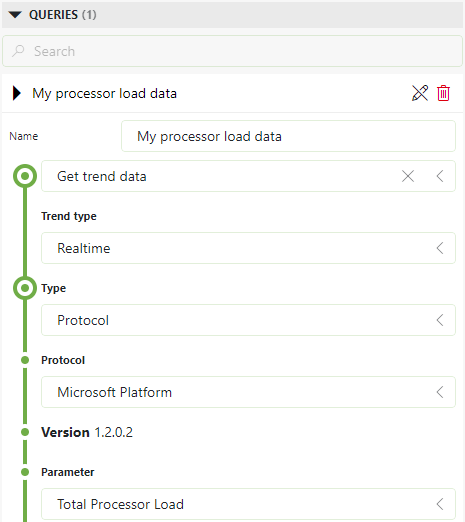
I want to build a proper GQI query to display the trend in gafana.
So I’m trying to build a query in Dashboard for the “processor load” parameter (Microfsoft Platform element).
I follow the instructions
but I don’t see the “History box” mentioned in Step1

Please write me how to build a query (for the trend) that I can later use in Grafana
Hi Piotr,
If you want to display regular DataMiner trend charts in Grafana, there is also an easier way that does not require to build any queries. You can find the explanation in our developer documentation: https://docs.dataminer.services/develop/ThirdParty/Grafana/Grafana_plugin.html#trend-data
I’d also like to point out that when you would use the GQI approach (using the ‘GenericInterface’ soft launch option), it should be prefer to use the new ‘Get trend data’ data source which is more intuitive than the ‘History data’ option:

Hi Piotr,
In order to see the history checkbox you will need to enable the softlaunch option GenericInterface.
Hi, I tried to do as you can see on your screen, but no matter which version I choose, at the next point it says ‘this.option is undefined’ and I can’t move on. Can you guess what is the cause ?